Download
1 / 11
110 likes | 121 Vues
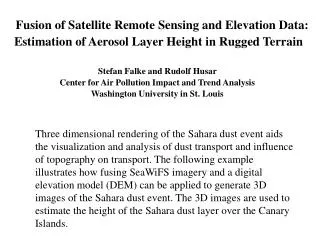
This report presents a preliminary analysis of carbon emissions on the Danforth Campus, focusing on energy use and transportation, comparing to other universities. Data on population, expenditures, and emission trends are included.

E N D
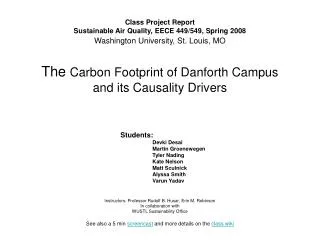
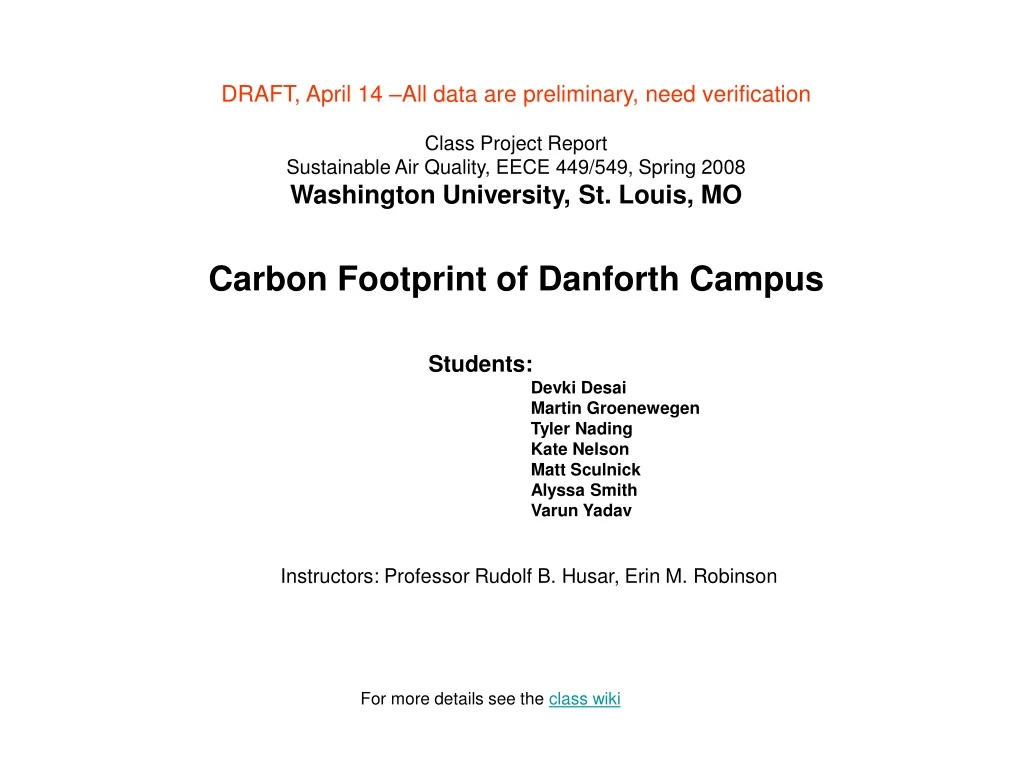
DRAFT, April 14 –All data are preliminary, need verificationClass Project ReportSustainable Air Quality, EECE 449/549, Spring 2008Washington University, St. Louis, MO Carbon Footprint of Danforth Campus Students: Devki Desai Martin Groenewegen Tyler Nading Kate Nelson Matt Sculnick Alyssa Smith Varun Yadav Instructors: Professor Rudolf B. Husar, Erin M. Robinson For more details see the class wiki
Class Project: Carbon Footprint of Danforth Campus Objectives: • Develop and Apply Carbon Emission Estimation Model • Estimate Carbon Footprint of Danforth Campus • Compare the Estimates to Other College Campuses
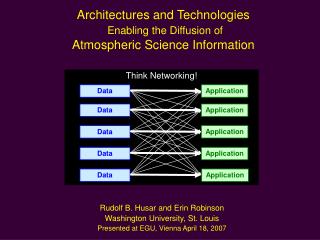
Washington University Carbon Footprint Heating On Campus Energy Use Carbon Impact Cooling Appliances Commuting Transportation Carbon Impact Air Travel University Fleet Students Faculty/Staff The impact on carbon arises from on-campus energy use and from transportation
Danforth Campus Population • From 1990-2005 the Campus population has fluctuated between 14-16,000 people • Students account for 80 percent of the population on campus
University Expenditures and Building Area 60% increase 70% increase During the same time period, the building area (sq ft) has increased by 60 percent. Expenditures Include: Research, Academic, Student Support, O/M of Physical Plant Between 1990-2005, the expenditures increased by 70%
Danforth Campus Electric Energy and Fuel Consumption • Fuel used on campus for heating and hot water: coal, oil and natural gas. • In 1993, the University made several upgrades: • Switched from coal to natural gas • Switched to electric chillers • Shut off steam plant from May-October hot water Purchased electricity increased 90% between 1990-2005. The total energy for electricity includes losses in the power plant and during transmission.
Causality Framework for University Carbon Footprint - Transportation Miles/Person Gal./Mile Carbon/Gal PopulationPeople Transportation Miles Fuel Cons. Gal./yr C Emission Ton C/yr • Overall the transportation carbon emissions have remained roughly at 1990 level
Carbon Emission – Danforth Campus • Carbon Emissions have increased almost 60% from 1990 to 2005. • Electricity is the main component of emissions and also drives the emissions trends
Total Emission Comparison between Universities • Data from 14 campuses show that the carbon impact is roughly proportional to the campus size. • Our data indicate that WU emissions/area are comparable to the other schools
Transportation Emission Comparison between Universities • Transportation carbon emission estimates for ten campuses indicate a relationship to school population • Washington University estimates are uncertain and given as a range based on two calculation methods • Evidently, the WU transportation carbon emissions are also comparable to the other colleges.
Class Outline Follows the NAS Report: Our Common Journey…Sustainability Transition (link) • Common Concerns, Differing Emphases • What Is To Be Sustained • What Is To Be Developed • The Links Between • For How Long? • Goals for a Sustainability Transition • Meeting Human Needs (Education, Research) • Preserving Life Support Systems (Climate) • The Transition to Sustainability as Social ( Academic) Learning