SA21A-0226
SA21A-0226 Solar Cycle Variability of O 2 and H 2 O Photodissociation Rates Calculated Using TIMED/SEE and UARS/SOLSTICE Observations: Intercomparison and Implications William H. Swartz, 1 Jeng-Hwa Yee, 1 and Thomas N. Woods 2

SA21A-0226
E N D
Presentation Transcript
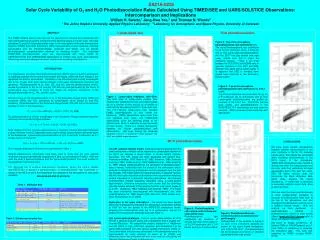
SA21A-0226 Solar Cycle Variability of O2 and H2O Photodissociation Rates Calculated Using TIMED/SEE and UARS/SOLSTICE Observations: Intercomparison and Implications William H. Swartz,1 Jeng-Hwa Yee,1 and Thomas N. Woods2 1The Johns Hopkins University Applied Physics Laboratory2Laboratory for Atmospheric and Space Physics, University of Colorado Lyman-alpha flux TOA photodissociation ABSTRACT The TIMED satellite mission has now had the opportunity to observe the mesosphere and lower thermosphere/ionosphere during the entire declining phase of a solar cycle. We have calculated O2 and H2O photodissociation rates in the mesosphere and lower thermosphere based on TIMED Solar EUV Experiment (SEE) measurements of solar irradiance, including Lyman-alpha and the Schumann-Runge continuum and bands, and we provide photodissociation parameterization schemes for modeling studies. Our calculated TIMED/SEE photodissociation rates are intercompared with those based on UARS/SOLSTICE and UARS/SUSIM observations of another solar cycle, and significant differences among the datasets are found, important for modeling considerations. Figure 2. Top-of-the-atmosphere photodissociation rate coefficients (left). The top-of-the-atmosphere rate coefficients for (a) O2 S-R continuum, (b) O2 S-R bands, and (c) H2O Lyman-alpha photodissociation, with the E10.7 flux also plotted (see right axes), scaled such that it tracks the computed j-values. There is an offset between the SOLSTICE and SUSIM data, in opposite directions in the SRC and SRB, although they agree well at Lyman-alpha. It is apparent that SEE is trending down toward solar minimum in the Schumann-Runge system. INTRODUCTION The mesosphere and lower thermosphere/ionosphere (MLTI) region of Earth’s atmosphere is a gateway between the terrestrial environment and space, where the Sun's energy is first deposited into Earth's environment. Variability in the ultraviolet (and shorter) wavelengths due to the 11-year solar cycle causes changes in the upper atmosphere’s chemistry and dynamics. Photodissociation of O2, H2O, CH4, and CO2 (and the photoionization of NO), caused by radiation in the far-UV (roughly 100–200 nm) and particularly by the Sun’s H Lyman-alpha (Ly) emission at 121.6 nm, shape the chemical composition of the atmosphere through the Ox, HOx, and NOx cycles. We focus here on the photodissociation of O2 in the Schumann–Runge bands (SRB) and continuum (SRC) and H2O, particularly by Lyman-alpha, which impact Ox and HOx chemistry. Photodissociation in the Schumann–Runge bands (175–203 nm) is the dominant pathway in much of the mesosphere: O2 + h (175<<203 nm) O(3P) + O(3P) (O2 SRB) O2 photodissociation at shorter wavelengths in the Schumann–Runge continuum becomes relatively more important at higher altitudes: O2 + h (<175 nm) O(1D) + O(3P) (O2 SRC) Solar radiation from the H Lyman-alpha emission is important in the terrestrial MLTI because a sharp minimum in the O2 absorption cross section allows Lyman-alpha to penetrate down to the stratopause. Lyman-alpha photodissociation of H2O in particular is important, as it is a major source of H and OH: H2O + h (Ly + 175<<203 nm) OH + H (H2O Ly+SRB) The molecular data used in this work are summarized in Table 1. Several satellite-borne instruments have been used to study how the solar spectral irradiance changes over relatively long periods of time, as summarized in Table 2. We have used the level 3 spectral irradiance and the Lyman-alpha products from each mission to investigate MLTI photochemistry. Our objectives are to examine measurement consistency among the various satellite instruments and to develop a parameterization of photodissociation rate coefficients (j-values) in the MLTI to aid in the modeling of the response of the atmosphere to solar cycle variability. Figure 3. Top-of-the-atmosphere photodissociation rate coefficients vs. E10.7 (right). Top-of-the-atmosphere rate coefficients for (a) O2 S-R continuum, (b) O2 S-R bands, and (c) H2O Lyman-alpha photodissociation are plotted as functions of the E10.7 flux. SOLSTICE has the least scatter, and parameterizations of the SOLSTICE-E10.7 relationships are also noted on the plots. SEE’s downward trend increases with wavelength. Figure 1. Lyman-alpha irradiance, 1991–2006. The total solar H Lyman-alpha product from TIMED/SEE, UARS/SOLSTICE, and UARS/SUSIM (a) as a function of time and (b) as a function of solar activity denoted by the E10.7 solar radio flux. The F10.7-derived Lyman-alpha from Nicolet’s [1985] parameterization is also shown for reference. UARS observations span more than one complete solar cycle, and TIMED/SEE observations cover the declining phase of the current cycle, which is presently at very low levels of solar activity. There is a notable discrepancy between the Nicolet parameterization and observations. But even among the observed datasets, there is a significant offset between the SEE and UARS measurements. MLTI photodissociation CONCLUSIONS We have found notable discrepancies between satellite measurements of the solar irradiance in the far UV, including Lyman-alpha, that should be considered when modeling photochemistry in the MLTI region of the atmosphere. TIMED/SEE observations have tended to diverge from other flux measurements and the solar radio flux, particularly at longer wavelengths and in the past two years. SEE V8 (latest version) does not incorporate the latest calibration data, which likely explains the recent discrepancy. A rocket flight is necessary to accurately calibrate recent data, close to solar minimum. We have used the three satellite datasets of solar extraterrestrial irradiance to compute photodissociation rates both at the top of the atmosphere and also throughout the atmosphere, with the aid of a radiative transfer model. With this analysis we have developed a parameterization scheme of photodissociation based on solar activity (here based on E10.7, for example) to speed atmospheric modeling. The APL radiative transfer model. Because multiple scattering from the lower atmosphere in twilight can be important for Lyman-alpha radiation in the MLTI, we selected a model known to handle twilight radiation accurately. The APL model has been developed and utilized [e.g., Anderson and Meier, 1979; Meier et al., 1982; Anderson, 1983; Anderson and Lloyd, 1990; Anderson et al., 1995; DeMajistre et al., 1995; Swartz et al., 1999; Swartz, 2002] primarily for the calculation of photodissociation rates (j-values), traditionally from the surface to the stratopause and in particular in twilight during stratospheric aircraft campaigns over the past two decades. The model solves the integral equation of radiative transfer, with the direct solar deposition and reflection from a Lambertian reflecting surface calculated in a spherical, refracting atmosphere, and isotropic monochromatic multiple scattering calculated using a plane-parallel approximation. Extensive comparisons have shown that this technique provides reliable estimates of the radiation field for solar zenith angles of up to 95° [Anderson, 1983; Dahlback and Stamnes, 1991]. The model has been extensively intercompared with measurements and other models [Swartz et al., 1999; Swartz, 2002; Bais et al., 2003; Shetter et al., 2003; Hofzumahaus et al., 2004]. Application to the upper atmosphere. The model has been applied above the stratopause by extending the atmospheric composition profiles to 1000 km with the benefit of the MSIS-E-90 atmosphere model, extending the extraterrestrial solar flux to H Lyman-alpha, and by the addition of the appropriate molecular data (see Table 1). H2O Lyman-alpha photolysis. Solar H Lyman-alpha radiation at 121.6 nm has a spectral emission profile with a distribution that is roughly self-reversed Gaussian. We adopted the analytic expression of Reddmann and Uhl [2003] at high (0.001-nm) resolution and normalized it to the Lyman-alpha products from the various satellite instruments (Table 2). The Lyman-alpha emission was attenuated in the atmosphere using the high-resolution O2 cross sections of Lewis et al. [1983], and photodissociation was computed with H2O cross sections compiled by the Harvard–Smithsonian Center for Astrophysics. MOLECULAR AND FLUX DATA Table 1. Molecular data Figure 4. Photodissociation rate variation with altitude and solar zenith angle. Photodissociation rate coefficients as functions of altitude and solar zenith angle for (a) O2 S-R continuum, (b) O2 S-R bands, and (c) H2O Lyman-alpha. Figure 5. Photodissociation rate coefficient profiles at selected solar zenith angles. Vertical slices of the contours in Figure 4 for each of the instruments datasets are shown for the same model atmosphere, with E10.7=210 SFU. Parameterizations will be developed as functions of absorber optical depth and solar activity. ACKNOWLEDGMENTS We thank B. Knapp (LASP/UC), M. Deland (SSAI at NASA/Goddard) and J. Cook (NRL) for assistance in compiling the instrument data. This work was supported by NASA contract NAS5-97179. Table 2. Extraterrestrial solar flux
Atmospheric Chemistry Experiment (ACE or SCISAT-I) Walker, K. A., et al. (U of Waterloo)
ACE • Examine chemical and dynamical processes • that control the distribution of ozone in the upper troposphere and stratosphere • Especially over Artic region • ACE/FTS: infrared measurement • Satellite measurements of the Earth’s atmosphere by occultation • around Arctic and Antarctic regions
ACE • Data Retrieval • Step 1: use CO2 to retrieve the pressure and temperature profile • Step 2: use the temperature profile to retrieve profiles for trace gases • Data products include O3, CH4, H2O, NO2, CO • Validation using ozone profiles from other measurements
Lyman-Alpha Mapping Project (LAMP) Retherford, K. D., et al. (SwRI)
LAMP • LAMP • On Lunar Reconnaissance Orbiter (LRO) • UV imaging spectrograph • Search for ice in permanently shadowed regions (PSRs) • Map landforms in PSRs • Measure the lunar FUV albedo • Assay lunar atmosphere
LAMP • Get a map of landform and albedo using the reflection of interplanetary diffuse illumination • E.g. HI Lyman-alpha, starlight
LAMP • Water Ice
LAMP • Lunar Atmosphere • Known species: Ar, He, Rn, Po, Na, K • Expected species: H, C, N, Mg • LAMP • By nadir and limb observation