Rediscovery of Pulsars J1842+0257 and J1812+0226
A student-led initiative rediscovered known pulsars J1842+0257 and J1812+0226 with data collected by The Green Bank Telescope. Discover the importance of finding already known pulsars.

Rediscovery of Pulsars J1842+0257 and J1812+0226
E N D
Presentation Transcript
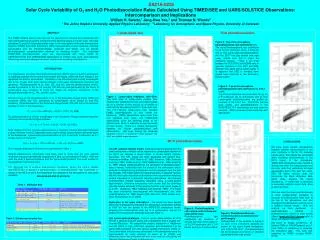
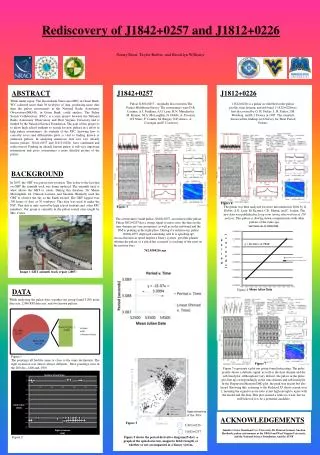
Rediscovery of J1842+0257 and J1812+0226 Sonny Ernst, Taylor Barber, and Brooklyn Williams ABSTRACT J1842+0257 J1812+0226 While under repair, The Green Bank Telescope(GBT) in Green Bank, WV collected more than 30 terabytes of data, producing more data than the pulsar astronomers at the National Radio Astronomy Observatory(NRAO), in Green Bank, could analyse. The Pulsar Search Collaboratory (PSC), is a joint project between the National Radio Astronomy Observatory and West Virginia University and is funded by the National Science Foundation. The goal of this project is to allow high school students to search for new pulsars in a effort to help pulsar astronomers. As students of the PSC, knowing how to correctly score and differentiate plots is vital to finding known or unknown pulsars. In analysing numerous data sets, two already known pulsars, J1842+0257 and J1812+0226, were confirmed and rediscovered. Finding an already known pulsar is still very important information and gives astronomers a more detailed picture of the pulsar. Pulsar J1802+0257 , originally discovered in The ParkesMultibeam Survey. The astronomers were D.R. Lorimer, A.J. Faulkner, A.G. Lyne, R.N. Manchester, M. Kramer, M.A. McLaughlin, G. Hobbs, A. Possenti, I.H. Stairs, F. Camilo, M. Burgay, N.D Amico, A. Corongiu and F. Crawford J1812+0226 is a pulsar as exhibited in the pulsar profile, time domain, and sub band. J 1812+0226was first discovered by G. H. Stokes, J. H. Taylor, J.M. Weisberg, and R.J. Dewey in 1985. The scientists discussed the findings in A Survey for Short Period Pulsars BACKGROUND In 2007, the GBT was put in stow position. This is due to the fact that on GBT the azimuth track was being replaced. The azimuth track is what allows the GBT to rotate. During this duration, Dr. Maura McLaughlin, Dr. Duncan Lorimer, and SueAnn Heatherly used the GBT to observe the sky as the Earth rotated. The GBT logged over 300 hours of data or 30 terabytes. This data was used to make the PSC. This data is only viewed by high school students and other PSC members. Our group is currently in the pulsar search class taught by Mrs. Carter. Figure 6 Figure 3 . The pulsar was then analyzed for more information in 2004 by G. Hobbs, A.G. Lyne, M. Kramer, C.E. Martin, and C. Jordan.The new data was published in Long-term timing observations of 374 pulsars. This pulsar is slowing down commensurate with other pulsars of the same age. • The astronomers found pulsar J1802+0257, an isolated older pulsar. Pulsar J802+0257 has a strong signal to noise ratio, the lines in the time domain are very prominent, as well as in the sub-band and the DM is peaking in the right place. During it’s rediscovery, pulsar J1802+0257 displayed something odd: It is speeding up! • An acceleration in speed implies a binary system, possible planets orbiting the pulsar, or a glitch has occurred (a cracking of the crust on the neutron star.) 762.0584216 age Image 1:GBT azimuth track repair (2007) DATA Figure 8 While analysing the pulsar data, together our group found 2,008 noise data sets, 2,986 RFI data sets, and two known pulsars. Figure 1 The pointings all had the same or close to the same declination. The right ascension was almost always different. Most pointings were in the 200 dec,-1400 and-1500 Figure 7 Figure 7 represents a plot our group found interesting. The pulse profile shows a definite signal; as well as the time domain and the sub-band plot. Although not very distinct, the pulses in the pulse plot line up correspondingly in the time domain and sub-band plot. In the Dispersion Measure(DM) plot, the peak was decent but also broad. Knowing this, referring to the Reduced X² shows a peak over 1, meaning the signal to noise ratio is just high enough to agree with the model and the data. This plot seemed a little too weak, but we still believed it to be a potential candidate. Approximation of the Pdot ACKNOWLEDGEMENTS Jennifer Carter, Morehead State University, Dr. Duncan Lorimer, SueAnn Heatherly, pulsar astronomers at the NRAO and West Virginia University, and the National Science Foundation. And the ATNF Figure 5 J1802+0226 J1842+0257 Figure 2 Figure 5 shows the period derivative diagram(P-dot). a graph of the spin down rate, magnetic field strength, or whether or not accompanied in a binary system.