Download
1 / 41
410 likes | 683 Vues
Chapter 12: The Human Population: Growth, Demography, and Carrying Capacity. Applying Population Ecology: The Human Population. Key Concepts. Factors affecting human population size. Human population problems. Managing population growth. http://www.youtube.com/watch?v=9_9SutNmfFk.

E N D
Chapter 12: The Human Population: Growth, Demography, and Carrying Capacity
Applying Population Ecology: The Human Population Key Concepts • Factors affecting human population size • Human population problems • Managing population growth
Big Idea The size and growth rate of human population has changed drastically over the last 200 years. Those changes have led to profound changes to almost every place on Earth.
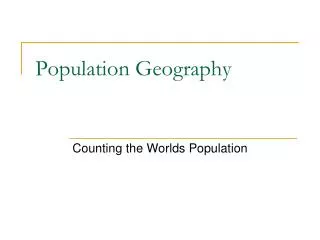
Describe what you see on this graph • How long did it take to get to 1 billion, than 2, 3,4,5,6 • How many people are living today? Did You Know?Basic sanitation was rare even in the medical profession until 1861, when Dr. IgnazSemmelweis discovered that doctors’ hand washing greatly reduced patient mortality.
Why did it take so long to reach 1 billion? • Why do you think it took off around the late 1880s? Interesting Fact: Of all the humans ever born, approximately 6-7% are alive today.
In 1850, the human population reached its first billion. • By 1930, it was 2 billion. • By 1960, the human population reached 3 billion. • Then in 1975, 4 billion, and so on…
Factors Affecting Human Population Size Population Change (Births + Immigration) – (Deaths + Emigration) = Demography is the study of the size, composition, and distribution of human populations and the causes and consequences of changes in these characteristics. Population change equation • Crude birth rate (BR) The crude birth rate is the number of live births per 1,000 people in a population in a specific year.| • Crude death rate (DR) The crude death rate is the number of deaths per 1,000 people in a population in a specific year
Describing Population Changes Doubling Times “Rule of 70”: Doubling time is one measure of population growth. Fertility-is the number of births that occur to an individual woman in a population. Replacement-level Fertility—the number of children a couple must have in order to replace themselves in a population. Total Fertility Rate (TFR) —the number of children a woman will bear during her lifetime; this information is based on an analysis of data from preceding years in the population in question. Who is Over Populated?
Rule of 70 • The Rule of 70 is useful for financial as well as demographic analysis. It states that to find the doubling time of a quantity growing at a given annual percentage rate, divide the percentage number into 70 to obtain the approximate number of years required to double. • For example, at a 10% annual growth rate, doubling time is 70 / 10 = 7 years. • Similarly, to get the annual growth rate, divide 70 by the doubling time. For example, 70 / 14 years doubling time = 5, or a 5% annual growth rate.
Rule of 70 • The following chart shows some examples:
TFR and RFR Total fertility rate (TFR) The average number of children born to a woman Average in developed countries = 1.5 Average in developing countries = 3.8 Worldwide 1990: 3.1 now: 2.76 Replacement fertility rate (RFR) The number of children a couple must have to replace themselves A TFR of 2.1 for developed countries with low infant and child mortality rates Africa RFR = 2.5
Factors Affecting Human Population Size (2005 Data) There are currently more births than deaths throughout the world. 1. The annual rate of natural population change (%) equals birth rate minus death rate divided by 1,000 persons multiplied by 100. 2. The rate of the world's population growth has decreased. The annual population growth dropped by almost half between 1963 and 2004, from 2.2% to 1.2%. But during this same period, the population base doubled from 3.2 to 6.4 billion. There is a big difference in the exponential population growth rates of developed and developing countries, with developed countries growing at 0.25% and developing countries growing at 1.46%— almost six times faster. The six fastest growing countries in terms of population are: India, China, Pakistan, Nigeria, Bangladesh, and Indonesia. The populations of China and India comprise 38% of the world's population. The next most populated country is the United Stated with 4.6% of the world's population.
Factors Affecting Birth Rates and Total Fertility Rates Many factors influence birth and fertility rates. More children work in developing countries; they are important to the labor force. The economic cost of raising and educating children determines their numbers. The more children cost, the less children people tend to have. If there are available private/public pension systems, adults have fewer children because they don't need children to take care of them in old age. People in urban areas usually have better access to family planning, so they have fewer children.
If women have educational and economic choices, they tend to have fewer children. When the infant mortality rate is low, people have fewer children because children are not being lost to death. The older the age at which women marry, the fewer children they bear. If abortions are available and legal, women have fewer children. The availability of reliable birth control allows women to space children and determine the number of children they bear.
U.S. Birth Rates: 1910-2004 Fig. 10-8, p. 180 32 30 28 26 24 Births per thousand population 22 20 Demographic transition End of World War II 18 Depression 16 Baby bust Echo baby boom Baby boom 14 0 2010 1910 1920 1930 1940 1950 1960 1970 1980 1990 2000 Year From 1946-1964, the United States had a sharp rise in birth rate, called the baby-boom period. At its peak, the TFR reached 3.7 children per woman. There has been a gradual decline since then. The population growth of the United States is still greater than any other developed country and is not close to leveling off.
Factors Affecting Human Population Size About 2.7 million people were added to the U.S. population in 2004. Fifty-five percent of this population growth came from more births than deaths, and forty-five percent came from immigration. Other major developed countries have slower population growth, and most are expected to have declining populations after 2010 The high U.S. per capita resource rate use produces enormous environmental impact.
Immigration Policy Arguments to limit immigration into the U.S. Limitations would aid in stabilizing the population sooner. Limitations would help reduce the enormous environmental impact of the U.S. Arguments for generous immigration policies in the U.S. Historically, the U.S. has been the land of opportunity for the world's poor. Immigrants do work that Americans won't do or handle jobs for which there are not enough trained natives. Immigrants contribute to the economy and pay taxes.
Factors Affecting Human Population Size Factors, which have caused a decline in death rates, are the following: Better food supplies and nutrition and safer water supplies contribute to people living longer. Advances in medicine and public health and improved sanitation and personal hygiene also contribute to people living longer. Life expectancy is the average number of years a newborn can expect to live. Infant mortality rate (IMR) is the number of babies out of every 1,000 born who die before their first birthday. a. This rate reflects a country's level of nutrition and health care. b. It is the single best measure of a society's quality of life. U.S. infant mortality rate is higher than 35 other countries due to: a. inadequate health care for poor women and for their babies, b. drug addiction among pregnant women, and c. a high birth rate among teenagers.
Age Structure • Relative number of organisms of each age group within population • Can be used to predict future population growth of a population • HOW?
Male Female Rapid Growth Guatemala Nigeria Saudi Arabia Slow Growth United States Australia Canada Zero Growth Spain Austria Greece Negative Growth Germany Bulgaria Sweden Ages 0-14 Ages 15-44 Ages 45-85+ Population Age Structure Fig. 10-14 p. 184
Stage 1 Preindustrial Stage 2 Transindustrial Stage 3 Industrial Stage 4 Postindustrial High 80 70 60 Birth rate 50 Birth rate and death rate (number per 1,000 per year) Relative population size 40 30 Death rate 20 10 Total population Low 0 Low growth rate Increasing Growth growth rate Very high growth rate Decreasing growth rate Low growth rate Zero growth rate Negative growth rate Time The Demographic Transition http://www.youtube.com/watch?v=q05dBq-6F0k
Stage 1 : High Birth AND Death rates = little population change • Stage 2 : Death Rates Fall, Birth Rates Still High = Population Growth • Stage 3: Death Rates Low, Birth Rates Drop = Population Growth Slows • Stage 4: Death Rates Low, Birth Rate Low = Population Declines DESCRIBE EACH STAGE: WHAT DO YOU SEE?
Solutions: Influencing Population Size • Migration • Environmental refugees • Reducing births • Family planning • Empowerment of women • Economic rewards and penalties
Case Study: Slowing Population Growth in India Generally disappointing results: • Poor planning • Bureaucratic inefficiency • Low status of women • Extreme poverty • Lack of support World in the Balance - India
Case Study: Slowing Population Growth in China • Economic incentives • Free medical care • Preferential treatment • Locally administered • Very intrusive and coercive World in the Balance - China
Population Growth in Sub-Saharan Africa How do different populations compare? Sub-Saharan Africa
Problems With Rapid Growth Lack of infrastructure to support population • Water supplies • Sewers • Roads • Schools • Powerplants • Hospitals • Housing
Problems With Rapid Growth Using up resources too quickly • Water supplies • Food Supplies, Vegetation • Wood/fuels : wood supplies critical to life in many regions
Problems With Rapid Growth Unsafe water supplies • Sewage mixing with water supplies • Cholera, Dysentery, Typhoid • 1 Billion lack clean water • 3 million/yr die
Clean Water Lacking If the millions of women who haul water long distances had a faucet by their door, whole societies could be transformed.
Problems With Rapid Growth Land becomes scarce • Arable land : land that can grow crops • Tradeoffs made : agriculture, housing, natural habitats • Which do you think typically wins out?
Problems With Rapid Growth Urbanization: movement of people from rural areas to cities • Much of world is going through • Increased demand on infrastructure
Problems With Growth In U.S. Suburban sprawl: work in cities live in suburbs • Decay of inner cities • Increased traffic • Loss of farmland • Decreased wildlife habitat
Cutting Global Population Growth • Family planning • Improve health care • Elevate the status of women • Increase education • Involve men in parenting • Reduce poverty • Sustainability
Calculations A town currently has a population of 20 people. If 10 people are born, 8 people die, 3 immigrate and 1 emigrate, what is the population?
Calculations USA currently has a population of 320,000,000 people. If 5,000,000 people are born, 2,000,000 people die, 200,000 immigrate and 50,000 emigrate, what is the population?
Rule of 70: Doubling Time Currently, a city has a population 10 million. When will it reach 20 million if the population is growing at 10%? How long will it take a population to go from 200 to 400 if it grows at 5% a year?