Download
1 / 1
10 likes | 245 Vues
Biomass non-radiative Influence from 1 to 3km. Biomass non-radiative Influence below 1 km. Observed and simulated CO concentrations over two Thailand surface stations, and our estimated biomass CO emissions in Southeast Asia (Woo et al, TRACEP issue). Biomass radiative Influence below 1 km.

E N D
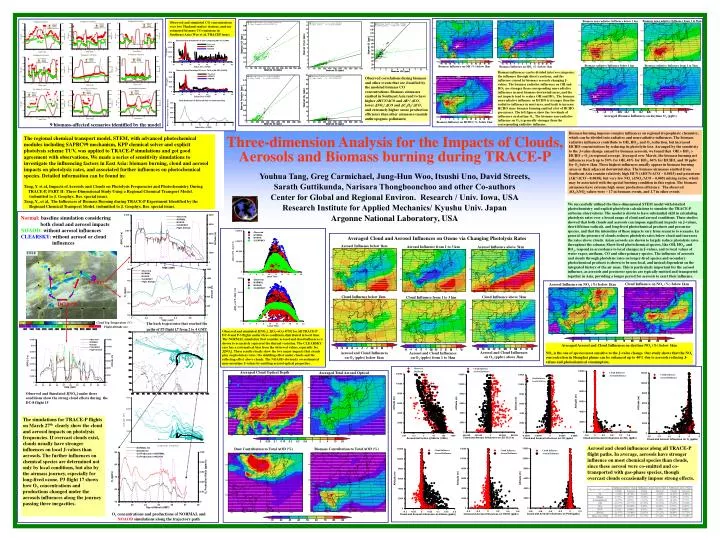
Biomass non-radiative Influence from 1 to 3km Biomass non-radiative Influence below 1 km Observed and simulated CO concentrations over two Thailand surface stations, and our estimated biomass CO emissions in Southeast Asia (Woo et al, TRACEP issue) Biomass radiative Influence below 1 km Biomass radiative Influence from 1 to 3km Biomass Influence on OH (%) below 1km Biomass Influence on HO2 (%) below 1km Biomass influences can be divided into two categories: the influence through direct reactions; and the influence caused by biomass aerosols changing J-values. The biomass radiative influences on OH and HO2 are stronger than corresponding non-radiative influences in most biomass downwind areas, and the net impacts tend to reduce OH and HO2. The biomass non-radiative influence on HCHO is stronger than the radiative influence in most area, and leads to increase HCHO since biomass burning emitted a lot of HCHO precursors. The left figures show the two kinds of influences on daytime O3. The biomass non-radiative influence on O3 is generally stronger than the corresponding radiative influence. Observed correlations during biomass and other events that are classified by the modeled biomass CO concentrations. Biomass airmasses emitted in Southeast Asia tend to have higher HCN/CO and K+/ CO, lower NOy/ CO and C2H2/ CO, and extremely higher ozone production efficiency than other airmasses (mainly anthropogenic pollutants) P-3 #17 Averaged Biomass Influences on daytime O3 (ppbv) Biomass Influence on HCHO (%) below 1km DC-8 #15 9 biomass-affected scenarios identified by the model Averaged Cloud Optical Depth Averaged Total Aerosol Optical Depth Cloud Influence on NOx (%) below 1km Aerosol Influence on NOx (%) below 1km Dust Contribution to Total AOD (%) Biomass Contribution to Total AOD (%) Observed and simulated J[NO2], J[O3O2+O1D] for All TRACE-P DC-8 and P-3 flights under three conditions distributed in local time. The NORMAL simulation that consider aerosol and cloud influences is shown to accurately represent the diurnal variation.The CLEARSKY case has a systematical bias from the observed values, especially for J[NO2]. These results clearly show the two major impacts that clouds play on photolysis rates: the shielding effect under clouds and the reflecting effect above clouds. The NOAOD obviously overestimated near-noontime J-values by omitting aerosol optical properties. Averaged Aerosol and Cloud Influences on daytime NOx (%) below 1km NOx is the one of species most sensitive to the J-value change. Our study shows that the NOx concentration in Shanghai plume can be enhanced up to 40% due to aerosols reducing J-values and photochemical consumption. Averaged Cloud and Aerosol Influences on Ozone via Changing Photolysis Rates Aerosol Influence below 1km Aerosol Influence from 1 to 3 km Aerosol Influence above 3km Aerosol and cloud influences along all TRACE-P flight paths. In average, aerosols have stronger influence on most chemical species than clouds, since these aerosol were co-emitted and co-transported with gas-phase species, though overcast clouds occasionally impose strong effects. Cloud Influence below 1km Cloud Influence above 3km Cloud Influence from 1 to 3 km Aerosol and Cloud Influences on O3 (ppbv) above 3km Aerosol and Cloud Influences on O3 (ppbv) below 1km Aerosol and Cloud Influences on O3 (ppbv) from 1 to 3km Biomass burning imposes complex influences on regional tropospheric chemistry, which can be divided into radiative and non-radiative influences. The biomass radiative influences contribute to OH, HO2, and O3 reduction, but increased HCHO concentrations by reducing its photolytic loss. Arranged by the sensitivity to the J-value change caused by biomass aerosols, we found that OH > HO2 > HCHO > O3 in regional average. Averaged over March, the biomass burning net influences reach up to 50% for OH, 40% for HO2, 60% for HCHO, and 10 ppbv for O3 below 1km. These highest influences usually appear in biomass burning areas or their adjacent downwind sites. The biomass airmasses emitted from Southeast Asia contain relatively high HCN (ΔHCN/ΔCO ~ 0.0015) and potassium (ΔK+/ΔCO ~ 0.0038), but very low NOy (ΔNOy/ΔCO ~ 0.005) mixing ratios, which may be associated with the special burning condition in this region. The biomass airmasses have extreme high ozone production efficiency. The observed ΔO3/ΔNOz values were ~ 17 in biomass events, and 1.7 in other events Three-dimension Analysis for the Impacts of Clouds, Aerosols and Biomass burning during TRACE-P Youhua Tang, Greg Carmichael, Jung-Hun Woo, Itsushi Uno, David Streets, Sarath Guttikunda, Narisara Thongboonchoo and other Co-authors Center for Global and Regional Environ. Research / Univ. Iowa, USA Research Institute for Applied Mechanics/ Kyushu Univ. Japan Argonne National Laboratory, USA The regional chemical transport model, STEM, with advanced photochemical modules including SAPRC99 mechanism, KPP chemical solver and explicit photolysis scheme TUV, was applied to TRACE-P simulations and got good agreement with observations. We made a series of sensitivity simulations to investigate the influencing factors in East Asia: biomass burning, cloud and aerosol impacts on photolysis rates, and associated further influences on photochemical species. Detailed information can be found in: Tang, Y. et al, Impacts of Aerosols and Clouds on Photolysis Frequencies and Photochemistry During TRACE-P, PART II: Three-Dimensional Study Using a Regional Chemical Transport Model. (submitted to J. Geophys. Res. special issue). Tang, Y., et al, The Influences of Biomass Burning during TRACE-P Experiment Identified by the Regional Chemical Transport Model. (submitted to J. Geophys. Res. special issue). We successfully utilized the three-dimensional STEM model with detailed photochemistry and explicit photolysis calculations to simulate the TRACE-P airborne observations. The model is shown to have substantial skill in calculating photolysis rates over a broad range of cloud and aerosol conditions. These studies showed that both clouds and aerosols can impose significant impacts on J-values, short-lifetime radicals, and long-lived photochemical products and precursor species, and that the intensities of these impacts vary from scenario to scenario. In general the presence of clouds reduces photolysis rates below cloud and increases the rates above clouds. Asian aerosols are shown to largely reduce photolysis rates throughout the column. Short-lived photochemical species, like OH, HO2, and RO2, respond in accordance to local changes in J-values, and to local values of water vapor, methane, CO and other primary species. The influence of aerosols and clouds through photolysis rates on longer-lived species and secondary photochemical products is shown to be non-local, and instead dependent on the integrated history of the air mass. This is particularly important for the aerosol influence, as aerosols and precursor species are typically emitted and transported together in Asia, providing a longer period for aerosols to exert their influence. Normal:baseline simulation considering both cloud and aerosol impacts NOAOD:without aerosol influences CLEARSKY:without aerosol or cloud influences The back trajectories that reached the paths of P3 flight 17 from 2 to 4 GMT Cloud Top Temperature (°C) Flight Altitude (m) Observed and Simulated J[NO2] under three conditions show the strong cloud effects during the DC-8 flight 15 The simulations for TRACE-P flights on March 27th clearly show the cloud and aerosol impacts on photolysis frequencies. If overcast clouds exist, clouds usually have stronger influences on local J-values than aerosols. The further influences on chemical species are determined not only by local conditions, but also by the airmass journey, especially for long-lived ozone. P3 flight 17 shows how O3 concentrations and productions changed under the aerosols influences along the journey passing three megacities. O3 concentrations and productions of NORMAL and NOAOD simulations along the trajectory path