Multi-Beam Lidar for ACE
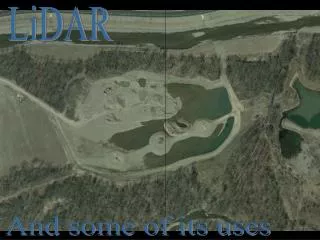
200 km. 200 km. Forest fires in Quebec generate thick smoke plumes transported to NE United States. Cross-track lidar example: 7 Fixed Lidar beams 0°, ±5°, ±10°, ±15° angles. Nadir-only lidar does not provide enough spatial coverage for most aerosol plumes.

Multi-Beam Lidar for ACE
E N D
Presentation Transcript
200 km 200 km Forest fires in Quebec generate thick smoke plumes transported to NE United States Cross-track lidar example: 7 Fixed Lidar beams 0°, ±5°, ±10°, ±15° angles Nadir-only lidar does not provide enough spatial coverage for most aerosol plumes Nadir vs. Cross-track Lidar Example: Improved spatial coverage through complicated aerosol plumes MODIS AOD MODIS AOD Wider swath profiling over difficult ocean biology regions Large regional aerosol variation Multi-Beam Lidar for ACE Peter Colarco, Judd Welton with contributions from Mark Schoeberl Lorraine Remer Chris Hostetler Rich Ferrare Matt McGill
MBL Charge What is the value of the MBL to ACE science objectives? What should the MBL configuration look like? Number of beams? Spacing along ground?
Motivation: Plume Coherence LITE: AOT along track crossing Atlantic Anderson et al., “Mesoscale Variations of Tropospheric Aerosols” [JAS, 2003] Over what time and space scales do aerosols vary? Analysis shows spatial variation on scales of ~40 - 160 km Analysis limited to a few ground stations, aircraft flights, single LITE overpass
Multi-Beam Lidar Trade Study MBL sampling MODIS Aqua AOT (20070719) MODIS Aqua AOT retrievals (25 km) Hypothetical MBL beam path MODIS AOT on beam paths Beam Cross Correlation
Along-Track Autocorrelation Sampling for July 13 - 31, 2007 Eastern Atlantic Caribbean Southeast Asia
Cross-Track Autocorrelation Sampling for July 13 - 31, 2007: Cross-Track in Dashed Lines Eastern Atlantic Caribbean Southeast Asia
Cross-Track Autocorrelation Sampling for July 13 - 31, 2007: Cross-Track in Dashed Lines Eastern Atlantic Caribbean Southeast Asia MBL +/- 15° Polarimeter +/- 45° ORCA +/- 60°
Aerosol Model Autocorrelation MODIS GEOS-5 Model
End of Talk • Aerosol Spatial Scales • Anderson et al. suggested aerosol homogeneity on scales of 40 - 160 km, but that study was limited to a single LITE overpass • We considered about three weeks of MODIS AOT observations sampled by the hypothetical MBL • Along-track correlation scales are shorter than Anderson showed... • ...and have maybe important regional variations • Cross-track correlation scales appear to be longer than along-track scales • Model correlation scales are generally longer than the observations • Limitations • Could consider longer time period, greater spatial area • How do we extend this analysis to vertical dimension?