Quantitative FRAP Analysis of Control Proteins in Tobacco and Arabidopsis Cells
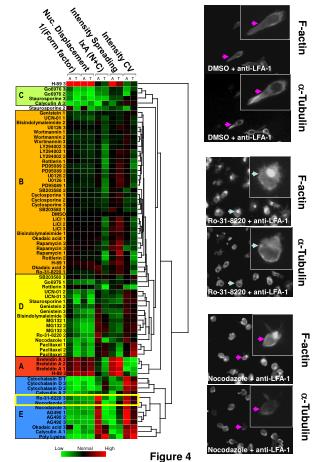
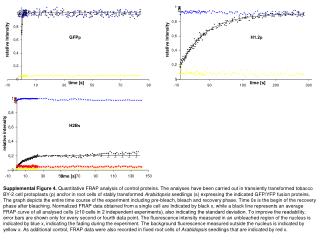
This study presents a quantitative fluorescence recovery after photobleaching (FRAP) analysis of control proteins, utilizing transiently transformed tobacco BY-2 cell protoplasts and root cells from stably transformed Arabidopsis seedlings expressing specific GFP/YFP fusion proteins. The graph illustrates the complete time course of the experiment, including pre-bleach, bleach, and recovery phases. It displays normalized FRAP data from individual cells and average curves across multiple analyses, highlighting fluorescence intensity changes in nucleus and background areas, with variability indicated.

Quantitative FRAP Analysis of Control Proteins in Tobacco and Arabidopsis Cells
E N D
Presentation Transcript
GFPp H1.2p relative intensity relative intensity time [s] time [s] H2Bs relative intensity time [s] Supplemental Figure 4. Quantitative FRAP analysis of control proteins. The analyses have been carried out in transiently transformed tobacco BY-2 cell protoplasts (p) and/or in root cells of stably transformed Arabidopsis seedlings (s) expressing the indicated GFP/YFP fusion proteins. The graph depicts the entire time course of the experiment including pre-bleach, bleach and recovery phase. Time 0s is the begin of the recovery phase after bleaching. Normalized FRAP data obtained from a single cell are Indicated by black x, while a black line represents an average FRAP curve of all analysed cells (≥10 cells in 2 independent experiments), also indicating the standard deviation. To improve the readability, error bars are shown only for every second or fourth data point. The fluorescence intensity measured in an unbleached region of the nucleus is indicated by blue x, indicating the fading during the experiment. The background fluorescence measured outside the nucleus is indicated by yellow x. As additional control, FRAP data were also recorded in fixed root cells of Arabidopsis seedlings that are indicated by red x.