Scatter Plots – Age and Reaction Time
150 likes | 629 Vues
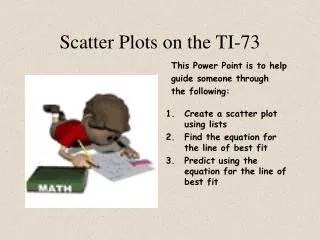
Scatter Plots – Age and Reaction Time. By: Heather, Robyn & Ryan. http://www.youtube.com/watch?v=9Iw3a_LtJVE. Digital Resource 1. Declarative and procedural knowledge. Defining the Key terms. Why do we use scatter plots? Time for you to create a scatter plot.

Scatter Plots – Age and Reaction Time
E N D
Presentation Transcript
Scatter Plots – Age and Reaction Time By: Heather, Robyn & Ryan
http://www.youtube.com/watch?v=9Iw3a_LtJVE Digital Resource 1
Declarative and procedural knowledge. • Defining the Key terms. • Why do we use scatter plots? • Time for you to create a scatter plot. • Using a scatter plot to make predictions. • Quick quiz • Mathematical worth of additional three digital resources. Overview
Scatter Diagram – A graph of plotted points that show the relationship between two sets of data. • Correlation – When the two sets of data are linked together; Co (meaning ‘together’), and Relation. • You will also see the words, Relationship and association. Definitions
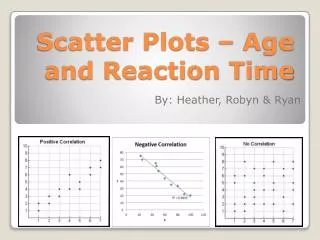
Positive Correlation – When the values increase together. • Negative Correlation – When one values decrease and the other increases. • No Correlation - Where a change in one set of data has no effect on the other set. Definitions
Line of best fit – To find the direction of a correlation between two variables. • Trend line - A line on a graph indicating a statistical trend Definitions
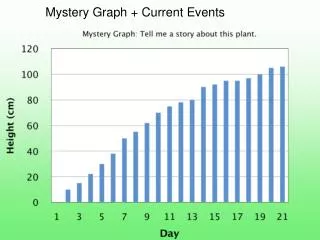
Bivariate data - a set up of data made up of two variables. • For example, comparing height to weight or age to reaction time. Definitions
Does the increase in temperature impact sunscreen sales? What do you think this scatter plot would look like? What Relationship is this?
If the price of bananas increase does this effect the amount of bananas sold? What would this scatter plot relationship look like? What Relationship is this?
If we plotted how old you are, and the results you got for your maths test, what correlation is there? What Relationship is this?
Thank you Visit our wiki to find out morehttp://mathshrr.wikispaces.com