Chapter 20: Populations
Chapter 20: Populations. 20-1 Understanding Populations. 20-2 Measuring Populations. 20-3 Human Population Growth. 20-1 Understanding Populations. I. Properties of Populations. SIZE, DENSITY, DISPERSION, and GROWTH RATE are DRIVEN by abiotic and biotic forces of the environment.

Chapter 20: Populations
E N D
Presentation Transcript
Chapter 20: Populations 20-1 Understanding Populations 20-2 Measuring Populations 20-3 Human Population Growth
20-1 Understanding Populations I. Properties of Populations • SIZE, DENSITY, DISPERSION, and GROWTH RATE are DRIVEN by abiotic and biotic forces of the environment.
(A) Population Size (estimate a “sampling size” distribution constant) • Size is a REPRODUCTIVE function of SPACE and RESOURCES in an ecosystem.
(B) Population Density • # of individuals PER unit of area of volume. • (Ex: In U.S., population density of humans is about 30/square kilometer; In Japan, 330/square kilometer –however, BOTH has similar pop size.)
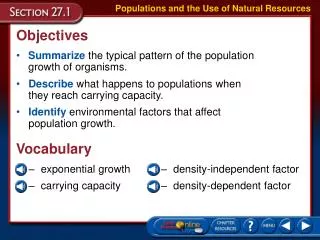
Critical Thinking (1) Because we have more power to alter our environment than other animals do, we can affect the carrying capacity of our environment. How do we increase or decrease the carrying capacity of our local area?
(C) Dispersion (influenced by species BEHAVIOR and RESOURCES) • SPATIAL distribution of individuals of a population WITHIN a geographical range.
(1) Clumped Dispersion • Occurs when resources are clumped OR may occur due to species social behavior, including herds and flocks.
(2) Even Dispersion • Usually result from TERRITORIALITY space is CLAIMED and DEFENDED against others who wish to use it.
(3) Random Dispersion (no pattern visible) • Results from seed dispersal (in wind-influenced plants) and is apparent in fields of wildflowers or forests.
II. Population Dynamics • Populations change in size and range over time. (i.e., this is the field of Population Ecology) NOTE: To understand HOW change occurs, we need to look to forces BEYOND size, density, and dispersion.
(1) Birth Rate (In U.S. 2003, 4 million/year) • Number of births occurring within a population over a period of time.
(2) Mortality Rate (In U.S., 2.4 million/year) • Number of deaths occurring within a population over a period of time.
(3) Life Expectancy (In U.S., 72 years male & 79 years female) • Age an individual of a population is expected to live (i.e., longevity).
(A) Age Structure • Distribution of individuals among AGE RANGE in a population. NOTE: In many species, including humans, the very old do NOT reproduce, thus populations with a greater proportion of YOUNGER individuals may have greater potential for a BURST of rapid growth.
(B) Patterns of Mortality • Mortality rate of different species tend to CONFORM to one of THREE CURVES on a graph. (i.e., survivorship curves)
(1) Survivorship Curves (based on reproductive strategies, evolution) • Displays the LIKELIHOOD of survival at DIFFERENT ages throughout the lifetime of the organism. • Type I: Ex: Humans, the likelihood of dying is SMALL until late in life. • Type II: Ex: Squirrels, the likelihood of dying is LINEAR to lifespan. • Type III: Ex: Oysters or Insects, the likelihood of dying young is HIGH, however if the young survives, it will likely LIVE OUT its lifespan.
20-2 Measuring Populations I. Population Growth Rate • Charles Darwin (1821) calculated that a SINGLE pair of elephants COULD increase to a population of 19 MILLION within 750 years.
Critical Thinking (2) Explain TWO difficulties an ecologist might have in counting a population of migratory birds. Develop and explain a method for estimating the size of such a population.
(1) Growth Rate (influenced by TWO processes, in addition to BR/DR) • The AMOUNT of change a population SIZE has over time. NOTE: By the end of this class PERIOD, the GLOBAL growth rate of H. sapiens will have increased by approximately 10,000 individuals.
Critical Thinking (3) Differentiate between growth rate and birth rate, and evaluate the statement that a DECREASING birth rate may lead to a DECREASING growth rate.
(2) Immigration (insignificant to global human population growth?) • Forces can drive members INTO a population INCREASING its size.
(3) Emigration (also insignificant to global human population growth) • Forces can drive members OUT of a population DECREASING its size.
Critical Thinking (4) Support the idea that immigration and emigration are insignificant factors when studying GLOBAL human population growth.
EX: Population ecologists divide large populations into groups of 1,000 and present their data PER CAPITA. • If, in ONE year, there are 52 BIRTHS and 14 DEATHS per 1,000 individuals in a large population, the PER CAPITA birth rate would be 52/1000 or 0.052 BIRTHS per individual per year. The PER CAPITA death rate would be 14/1000 or 0.014 deaths per individual per year. • THUS, The per capita GROWTH rate can be found by: • BIRTH RATE – DEATH RATE = GROWTH RATE 0.052 (births per capita) – 0.014 (deaths per capita) = + 0.038 (+ growth) • Therefore, if the sample population is 50,000 individuals, then in ONE year, the population should INCREASE by—(0.038 x 50,000) = 1,900.
II. The Exponential Model (ONLY occurs with NO limiting factors present) • The LARGER the population becomes, the MORE RAPIDLY it grows.
(1) Exponential Growth (binary fission) • The population increase of BACTERIA in the lab produces a J-SHAPED graph of UNLIMITED growth.
(A) Predictions Based on the Exponential Model • Assumes birth/death rates remain CONSTANT and NO limiting factors exist on the population. Ex: Bacteria colony estimated size at time (t) 0 1,000, at (t) 4, what SHOULD the colony population size be approximating? 16,000 (1K-2K-4K-16K) [An example of predicting exponential growth]
(B) Limitations of the Exponential Model • Do populations grow exponentially? Yes, but only under RARE conditions and ONLY for a SHORT period of time. NOTE: An abundance of space and nutrition must be supplied, and waste must be adequately neutralized.
(1) Limiting Factor (abiotic and biotic limiting factors exist in nature) • A factor that RESTRAINS the growth of a population and PREVENTS prolonged exponential growth.
III. The Logistic Model (BIRTH rate dec/DEATH rate inc as pop. GROWS) • LIMITING FACTORS establish a CARRYING CAPACTIY (K) for the population (i.e., Results in a stretched out, S-SHAPED graph).
(1) Carrying Capacity (“K” influenced by limiting factors) • The SIZE of a POPULATION that an environment can SAFELY SUPPORT over a LONG period of time.
(2) Logistic Growth • Graph describes a population STABILIZING around K. (At K, birth and death rates are ~ EQUAL and growth rate LEVELS OFF (plateau).
IV. Population Regulation • Size is “KEPT IN CHECK” by TWO classes of limiting factors, grouped by their relationship to population DENSITY.
(1) Density-Independent Factors (hurricanes, drought, floods, eruptions) • Include climate and natural disasters factors REDUCE the population by the SAME proportion, REGARDLESS of the population’s SIZE.
(2) Density-Dependent Factors • Include RESOURCE limitations, such as SHORTAGES of food or territory and are TRIGGERED by increasing population DENSITY.
Critical Thinking (5) Explain how disease could be a density-dependent factor in a population.
(A) Population Fluctuations • CHANGES are LINKED to the biotic and abiotic forces of the environment. (e.g., food availability, disease, predation) • Ex: Charles Elton’s research of the HARE and LYNX populations. (i.e., each species REGULATED the other species’ GROWTH cycle; i.e., the cycles fluctuate TOGETHER)