Advanced Data Mining: Understanding Queries and Processing Techniques
Explore the intricate details of data mining queries and processing within database systems. Learn about query optimization, code generation, and the essential steps involved in developing efficient Data Mining Query processors. Delve into Machine Learning, Association Rule Mining, Clustering, and Classification to enhance your data analysis skills.

Advanced Data Mining: Understanding Queries and Processing Techniques
E N D
Presentation Transcript
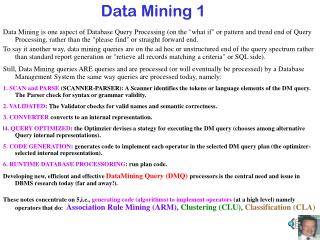
Data Mining 1 Data Mining is one aspect of Database Query Processing (on the "what if" or pattern and trend end of Query Processing, rather than the "please find" or straight forward end. To say it another way, data mining queries are on the ad hoc or unstructured end of the query spectrum rather than standard report generation or "retieve all records matching a criteria" or SQL side). Still, Data Mining queries ARE queries and are processed (or will eventually be processed) by a Database Management System the same way queries are processed today, namely: 1. SCANand PARSE (SCANNER-PARSER): A Scanner identifies the tokens or language elements of the DM query. The Parser check for syntax or grammar validity. 2. VALIDATED: The Validator checks for valid names and semantic correctness. 3. CONVERTER converts to an internal representation. |4. QUERY OPTIMIZED: the Optimzier devises a stategy for executing the DM query (chooses among alternative Query internal representations). 5. CODE GENERATION: generates code to implement each operator in the selected DM query plan (the optimizer-selected internal representation). 6. RUNTIME DATABASE PROCESSORING: run plan code. Developing new, efficient and effective DataMining Query (DMQ) processors is the central need and issue in DBMS research today (far and away!). These notes concentrate on 5,i.e., generating code (algorithms) to implement operators (at a high level) namely operators that do: Association Rule Mining (ARM), Clustering (CLU),Classification (CLA)
Database analysiscan be broken down into 2 areas, Querying and Data Mining. * * * Data Mining can be broken down into 2 areas, Machine Learning and Assoc. Rule Mining Machine Learning can be broken down into 2 areas, Clustering and Classification. Clustering can be broken down into 2 types, Isotropic (round clusters) and Density-based Classification can be broken down into to types, Model-based and Neighbor-based Machine Learning is almost always based on Near Neighbor Set(s), NNS. Clustering, even density based, identifies near neighbor cores 1st (round NNSs, about a center). Classification is continuity based and Near Neighbor Sets (NNS) are the central concept in continuity >0 >0 : d(x,a)< d(f(x),f(a))< where f assigns a class to a feature vector, or -NNS of f(a), a -NNS of a in its pre-image. f(Dom) categorical >0 : d(x,a)<f(x)=f(a) Caution: For classification, boundary analysis may be needed also to see the class (done by projecting?). 1234 Finding NNS in lower a dimension may still the 1st step. Eg, 12345678 are all from a 5a6(unclassified sample); 1234 are red-class, 5678 are blue-class. 7 8 Any that gives us a vote gives us a tie vote (0-to-0 then 4-to-4). But projecting onto the vertical subspace, then taking /2 we see that /2 about a contains only blue class (5,6) votes. Using horizontal data, NNS derivation requires ≥1 scan (O(n)). Lε-NNS can be derived using vertical-data in O(log2n) (but Euclidean disks are preferred). (Euclidean and L coincide in Binary data sets).
A t1 i1 t2 i2 t3 i3 t4 i4 t5 C T I AssociationRule Mining (ARM) Assume a relationship between two entities, T(e.g., a set of Transactions an enterprise performs) and I(e.g., a set of Items which are acted upon by those transactions). In Market Basket Research (MBR)a transaction is a checkout transaction and an item is an Item in that customer's market basket going thru check out). An I-Association Rule, AC, relates 2 disjoint subsets of I (I-temsets) has 2 main measures,support and confidence(A is called the antecedent, C is called the consequent) The support of an I-set, A, is the fraction of T-instances related to every I-instance in A, e.g. if A={i1,i2} and C={i4} then supp(A)= |{t2,t4}|/|{t1,t2,t3,t4,t5}| = 2/5 Note: | | means set size or count of elements in the set. I.e., T2 and T4 are the only transactions from the total transaction set, T={T1,T2,T3,T4,T5}. that are related to both i1 and i2, (buy i1 and i2 during the pertinent T-period of time). support of rule, AC,is defined as supp{A C} = |{T2, T4}|/|{T1,T2,T3,T4,T5}| = 2/5 confidence of rule, AC,is supp(AC)/ supp(A) = (2/5) / (2/5) = 1 DM Queriers typically wantSTRONG RULES: supp≥minsupp, conf≥minconf(minsupp and minconf are threshold levels) Note that Conf(AC) is also just the conditional probability of t being related to C, given that t is related to A). There are also the dual concepts of T-association rules (just reverse the roles of T and I above). Examples of Association Rules include: The MBR, relationship between customer cash-register transactions, T, and purchasable items, I (t is related to i iff i is being bought by that customer during that cash-register transaction.). In Software Engineering (SE), the relationship between Aspects, T, and Code Modules, I (t is related to i iff module, i, is part of the aspect, t). In Bioformatics, the relationship between experiments, T, and genes, I (t is related to i iff gene, i, expresses at a threshold level during experiment, t). In ER diagramming, any “part of” relationship in which iI is part of tT (t is related to i iff i is part of t); and any “ISA” relationship in which iI ISA tT (t is related to i iff i IS A t) . . .
3 2 2 1 1 1 3 2 2 1-itemset supp Large (supp2) Start by finding large 1-ItemSets. Finding Strong Association Rules Transaction Bitmap Tab;e can be expressed using “Item bit vectors” The relationship between Transactions and Items can be expressed in a Transaction Tablewhere each transaction is a row containing its ID and the list of the items that are related to that transaction: If minsupp is set by the querier at .5 and minconf at .75: To findfrequent or Large itemsets(support ≥ minsupp) PseudoCode: Assume the items in Lk-1 are ordered: Step 1: self-joining Lk-1 insert into Ck select p.item1, p.item2, …, p.itemk-1, q.itemk-1 p from Lk-1, q from Lk-1 where p.item1=q.item1,..,p.itemk-2=q.itemk-2, p.itemk-1<q.itemk-1 Step 2: pruning • forall itemsets c in Ck do • forall (k-1)-subsets s of c do • if (s is not in Lk-1) delete c from Ck (inheritance property) Any subset of a large itemset is large. Why? (e.g., if {A, B} is large, {A} and {B} must be large) APRIORI METHOD: Iteratively find the large k-itemsets, k=1... Find all association rules supported by each large Itemset. Ck denotes candidate k-itemsets generated at each step. Lk denotes Large k-itemsets.
Database D L3 C1 L1 C2 L2 C3 C2 itemset Scan D {2 3 5} {1 2 3} {1,3,5} Scan D Scan D P1 2 //\\ 1010 P2 3 //\\ 0111 P1^P2^P3 1 //\\ 0010 Build Ptrees: Scan D P1^P2 1 //\\ 0010 P3 3 //\\ 1110 P1^P3 ^P5 1 //\\ 0010 P1^P3 2 //\\ 1010 P4 1 //\\ 1000 P2^P3 ^P5 2 //\\ 0110 P5 3 //\\ 0111 P1^P5 1 //\\ 0010 L2={13}{23}{25}{35} L1={1}{2}{3}{5} L3={235} P2^P3 2 //\\ 0110 P2^P5 3 //\\ 0111 P3^P5 2 //\\ 0110 {123} pruned since {12} not large {135} pruned since {15} not Large Example ARM using uncompressed P-trees(note: I have placed the 1-count at the root of each Ptree)
L3 L1 L2 1-ItemSets don’t support Association Rules (They will have no antecedent or no consequent). 2-Itemsets do support ARs. Are there any Strong Rules supported by Large 2-ItemSets(at minconf=.75)? {1,3} conf{1}{3} = supp{1,3}/supp{1} = 2/2 = 1 ≥ .75 STRONG conf{3}{1} = supp{1,3}/supp{3} = 2/3 = .67 < .75 {2,3} conf{2}{3} = supp{2,3}/supp{2} = 2/3 = .67 < .75 conf{3}{2} = supp{2,3}/supp{3} = 2/3 = .67 < .75 {2,5} conf{2}{5} = supp{2,5}/supp{2} = 3/3 = 1 ≥ .75STRONG! conf{5}{2} = supp{2,5}/supp{5} = 3/3 = 1 ≥ .75STRONG! {3,5} conf{3}{5} = supp{3,5}/supp{3} = 2/3 = .67 < .75 conf{5}{3} = supp{3,5}/supp{5} = 2/3 = .67 < .75 Are there any Strong Rules supported by Large 3-ItemSets? {2,3,5} conf{2,3}{5} = supp{2,3,5}/supp{2,3} = 2/2 = 1 ≥ .75STRONG! conf{2,5}{3} = supp{2,3,5}/supp{2,5} = 2/3 = .67 < .75 No subset antecedent can yield a strong rule either (i.e., no need to check conf{2}{3,5} or conf{5}{2,3} since both denominators will be at least as large and therefore, both confidences will be at least as low. conf{3,5}{2} = supp{2,3,5}/supp{3,5} = 2/3 = .67 < .75 No need to check conf{3}{2,5} or conf{5}{2,3} DONE!
Ptree Review: A data table, R(A1..An), containing horizontal structures (records) is Vertical basic binary Predicate-tree (P-tree): vertically partition table; compress each vertical bit slice into a basic binary P-tree as follows R( A1 A2 A3 A4) R[A1] R[A2] R[A3] R[A4] 010 111 110 001 011 111 110 000 010 110 101 001 010 111 101 111 101 010 001 100 010 010 001 101 111 000 001 100 111 000 001 100 010 111 110 001 011 111 110 000 010 110 101 001 010 111 101 111 101 010 001 100 010 010 001 101 111 000 001 100 111 000 001 100 Horizontal structures (records) Scanned vertically R11 R12 R13 R21 R22 R23 R31 R32 R33 R41 R42 R43 0 1 0 1 1 1 1 1 0 0 0 1 0 1 1 1 1 1 1 1 0 0 0 0 0 1 0 1 1 0 1 0 1 0 0 1 0 1 0 1 1 1 1 0 1 1 1 1 1 0 1 0 1 0 0 0 1 1 0 0 0 1 0 0 1 0 0 0 1 1 0 1 1 1 1 0 0 0 0 0 1 1 0 0 1 1 1 0 0 0 0 0 1 1 0 0 0 1 0 1 0 0 0 0 1 0 01 0 1 0 0 1 01 1. Whole file is not pure1 0 2. 1st half is not pure1 0 0 0 0 0 1 01 P11 P12 P13 P21 P22 P23 P31 P32 P33 P41 P42P43 3. 2nd half is not pure1 0 0 0 0 0 1 0 0 10 01 0 0 0 1 0 0 0 0 0 0 0 1 01 10 0 0 0 0 1 10 0 0 0 0 1 10 0 0 0 0 1 0 0 0 0 0 0 0 0 0 0 0 0 0 1 1 0 1 0 0 0 0 1 0 1 4. 1st half of 2nd half not 0 0 0 1 0 1 01 5. 2nd half of 2nd half is 1 0 1 0 6. 1st half of 1st of 2nd is 1 Eg, Count number of occurences of 111 000 001 1000 23-level P11^P12^P13^P’21^P’22^P’23^P’31^P’32^P33^P41^P’42^P’43 =0 0 22-level=2 01 21-level 7. 2nd half of 1st of 2nd not 0 processed vertically (vertical scans) then process using multi-operand logical ANDs. R11 0 0 0 0 1 0 1 1 The basic binary P-tree, P1,1, for R11 is built top-down by record truth of predicate pure1 recursively on halves, until purity. But it is pure (pure0) so this branch ends
R11 0 0 0 0 1 0 1 1 Top-down construction of basic binary P-trees is good for understanding, but bottom-up is more efficient. 0 0 0 0 0 1 0 0 0 0 0 1 1 1 Bottom-up construction of P11 is done using in-order tree traversal and the collapsing of pure siblings, as follow: P11 R11 R12 R13 R21 R22 R23 R31 R32 R33 R41 R42 R43 0 1 0 1 1 1 1 1 0 0 0 1 0 1 1 1 1 1 1 1 0 0 0 0 0 1 0 1 1 0 1 0 1 0 0 1 0 1 0 1 1 1 1 0 1 1 1 1 1 0 1 0 1 0 0 0 1 1 0 0 0 1 0 0 1 0 0 0 1 1 0 1 1 1 1 0 0 0 0 0 1 1 0 0 1 1 1 0 0 0 0 0 1 1 0 0 0
Processing Efficiencies? (prefixed leaf-sizes have been removed) R[A1] R[A2] R[A3] R[A4] 010 111 110 001 011 111 110 000 010 110 101 001 010 111 101 111 101 010 001 100 010 010 001 101 111 000 001 100 111 000 001 100 010 111 110 001 011 111 110 000 010 110 101 001 010 111 101 111 101 010 001 100 010 010 001 101 111 000 001 100 111 000 001 100 = R11 R12 R13 R21 R22 R23 R31 R32 R33 R41 R42 R43 0 1 0 1 1 1 1 1 0 0 0 1 0 1 1 1 1 1 1 1 0 0 0 0 0 1 0 1 1 0 1 0 1 0 0 1 0 1 0 1 1 1 1 0 1 1 1 1 1 0 1 0 1 0 0 0 1 1 0 0 0 1 0 0 1 0 0 0 1 1 0 1 1 1 1 0 0 0 0 0 1 1 0 0 1 1 1 0 0 0 0 0 1 1 0 0 0 0 0 1 0 01 0 1 0 1 0 0 1 0 0 1 01 This 0 makes entire left branch 0 7 0 1 4 These 0s make this node 0 P11 P12 P13 P21 P22 P23 P31 P32 P33 P41 P42 P43 These 1s and these 0s make this 1 0 0 0 0 1 01 0 0 0 0 1 0 0 10 01 0 0 0 1 0 0 0 0 0 0 0 1 01 10 0 0 0 0 1 10 To count occurrences of 7,0,1,4 use pure111000001100: 0 P11^P12^P13^P’21^P’22^P’23^P’31^P’32^P33^P41^P’42^P’43 = 0 0 01 0 1 0 ^ ^ ^ ^ ^ ^ ^ ^ ^ 0 0 1 0 1 0 0 1 0 1 01 ^ 0 1 0 R(A1 A2 A3 A4) 2 7 6 1 6 7 6 0 2 7 5 1 2 7 5 7 5 2 1 4 2 2 1 5 7 0 1 4 7 0 1 4 21-level has the only 1-bit so the 1-count = 1*21 = 2
Ptree-ARM versus Apriori on aerial photo (RGB) data together with yeild data P-ARM compared to Horizontal Apriori (classical) and FP-growth (an improvement of it). • In P-ARM, we find all frequent itemsets, not just those containing Yield (for fairness) • Aerial TIFF images (R,G,B) with synchronized yield (Y). Scalability with number of transactions Scalability with support threshold • Identical results • P-ARM is more scalable for lower support thresholds. • P-ARM algorithm is more scalable to large spatial datasets. • 1320 1320 pixel TIFF- Yield dataset (total number of transactions is ~1,700,000).
P-ARM versus FP-growth (see literature for definition) 17,424,000 pixels (transactions) Scalability with support threshold Scalability with number of trans • FP-growth = efficient, tree-based frequent pattern mining method (details later) • For a dataset of 100K bytes, FP-growth runs very fast. But for images of large size, P-ARM achieves better performance. • P-ARM achieves better performance in the case of low support threshold.
Other methods (other than FP-growth) to Improve Apriori’s Efficiency(see the literature or the html notes 10datamining.html in Other Materials for more detail) • Hash-based itemset counting: A k-itemset whose corresponding hashing bucket count is below the threshold cannot be frequent • Transaction reduction: A transaction that does not contain any frequent k-itemset is useless in subsequent scans • Partitioning: Any itemset that is potentially frequent in DB must be frequent in at least one of the partitions of DB • Sampling: mining on a subset of given data, lower support threshold + a method to determine the completeness • Dynamic itemset counting: add new candidate itemsets only when all of their subsets are estimated to be frequent • The core of the Apriori algorithm: • Use only large (k – 1)-itemsets to generate candidate large k-itemsets • Use database scan and pattern matching to collect counts for the candidate itemsets • The bottleneck of Apriori: candidate generation 1. Huge candidate sets: • 104 large 1-itemset may generate 107 candidate 2-itemsets • To discover large pattern of size 100, eg, {a1…a100}, we need to generate 2100 1030 candidates. • 2. Multiple scans of database: (Needs (n +1 ) scans, n = length of the longest pattern)