Download
1 / 38
380 likes | 574 Vues
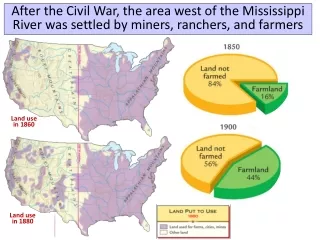
Land Use in the US. Dana Constantine Lesleigh Dexter Rick Howard. Major Land Uses. Grassland, pasture, and range 31% of land use – 578 millions acres Decline since mid 60’s of 636 million acres Reasons for decline: improved forage quality Increased productivity

E N D
Land Use in the US Dana Constantine Lesleigh Dexter Rick Howard
Major Land Uses Grassland, pasture, and range • 31% of land use – 578 millions acres • Decline since mid 60’s of 636 million acres • Reasons for decline: • improved forage quality • Increased productivity • declining numbers of domestic animals
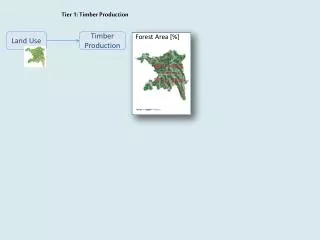
Major Land Uses Forest land • 29% of land use in US • 553 million acres allowed for timber production • 65 million acres that prohibit timber production (i.e. wilderness areas, state and federal parks)
Major Land Uses Cropland • 24% of land use – 455 million acres • Designated for crops, pasture and idled cropland • Lowest amount - 1964 with 444 million acres • 2 major peaks of cropland: • 1949: 470 million acres • between 1978-1982
Major Land Uses Special Uses • 11% of land use – 207 million acres • Includes: • Urban areas • Rural transportation • Rural parks and wildlife • Defense and industrial uses • Farmstead/farm roads and lanes • Other misc. non-farm uses • Increased 328% from 15 million acres in 1945 to 64 million acres in 1997
Major Land Uses Miscellaneous other land uses • 6% of land use – 102 million acres • Consists of: • marshes and swamps not included in other land uses • bare rock areas, deserts • other uses not inventoried • Decreased until 1964 but now increasing
Regional Changes in Land use Cropland: • Increased in the Northern Plains, Mountain, Corn Belt, Southern Plains and Pacific regions • Decreased in the Northeast, Appalachian, Southeast, Delta and Lake States from: • Failing small farms • Increased urbanization • Increased taxes • Decreased profit margin
Regional Changes in Land use Grassland: • Increased in the Southern Plains and South East • Decreased in all other areas • Decreases due to: • reforestation of abandoned small farm • urbanization • concentration of the dairy industry • conversion to cropland
Regional Changes in Land use Forest land: • Increased in the Northeast and Appalachian regions • Due to reforestation of farmlands • Decreased in the Pacific and Mountain regions • Due to conversion to recreation and wildlife areas
Regional Changes in Land use Special Uses Land: • Increased in all areas except the Northern Plains • Due to recreational and wildlife use, urbanization, and transportation • National defense areas and miscellaneous farm uses decreased in all areas
Crop Land Usage • Crop land: idled crop land, crop land in pastures and crop land in crops Typical harvest: - 2-3% crop failure - 5-10% summer fallow Corn, soybeans, wheat and hay account for 80% of harvested crops
Federal Programs for Idle Crop Land • Acreage Reduction Program required participants in USDA commodity programs to idle a percentage of crop acreage • Eliminated in 1996 Farm Act • Conservation Reserve Program: • current program has 30 million acres of idle crop land
Federal Lands • 563 million acres of U.S. are federally owned • BLM manages 264 million acres • FS manages 192 million acres • Both BLM and FS manage land for: • Grazing • Timber • Oil, gas, and minerals • Recreation • Conservation practices • FWS and NPS manage the remainder for recreation and conservation
Use of Federal Lands Conflicts can arise when dealing with the management of federal lands Multiple Use Sustained Yield Act -1960 - Federal land must be managed for multiple use • Timber, grazing and mining vs. conservation and recreation
Federal Restrictions on Public and Private Land Use • Government Regulations: • Endangered Species Act • Clean Water Act • Conservation Easements: • Wetlands Reserve Program • Federal Tax Codes • Conservation Contracts: • Conservation Reserve Program
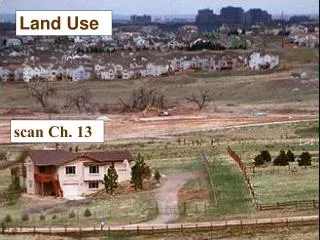
Urbanization • Land converted to urban use comes from several different land uses • Conversion to urban use is mainly irreversible • Urbanization impacts many facets: • food and fiber production • open spaces • rural lifestyles • local rural economies • unique farmlands • infrastructure costs • watershed protection
Urbanization • Most urban areas are surrounded by prime farmland and expansion must occur on the surrounding land • The main concern is that all prime farmland will be converted into urban use areas
Wetlands • Wetlands provide: • Wildlife habitat • Storm-water storage • Groundwater recharge • Pollution control • Recreation • 1780 – 221 million acres of wetlands • Currently - 124 million acres of wetlands • 80% of wetlands lost were converted to agricultural lands. • 90% of current wetlands are on non-federal rural lands
Protection of Wetlands • Agriculture policies are increasingly emphasizing wetland conservation • 1990 & 1996 Farm Acts: • Swampbuster • any conversion of wetlands means loss of eligibility for all farm program benefits • Wetlands Reserve Program • encourages wetland restoration with payments and cost shares to farmers
Farm Land • Farm real estate is the main source for collateral for farm loans • In 2000, 54% of total farm sector debt was real estate debt • Avg. farmland values have increased from $599/acre to $1,130/acre
Cash Rents • Cash rent: • amount of cash paid by a tenant to a landowner for the use of a parcel of farmland • Approximately 41% of farmland is operated under some form of lease • To tenants, cash rents represent a major expense • High value crops tend to bring high cash rents (ex. California, Midwest)
Land Tenure Rental Advantages: • Access to more land without capital • Avoid risk of asset depreciation • Flexibility of size and types of land use
Grazing Fees • Grazing fee: • the use of pasture or rangeland where payments are based on “grazing units” instead of acres • Grazing unit Animal Unit Month • One cow or cow-calf pair OR seven goats/sheep • Avg. $12.60 per AUM in 2000 • Fees have been rising over the last decade
Agricultural Real Estate Taxes • Property taxes are a direct cost to landowners • But when landowners rent farmland, those taxes are passed on to the tenant cost of production for all operators
Encouraging Farming • All 50 states have laws on preferential land-use assessment • These laws permit farmland devoted to farming be assessed based on it’s use as farmland • Extremely beneficial to farmland owners near urban areas • Reward farms and ranches for providing open space, habitat for wildlife, and environmental amenities
Determining Farmland Value • Intrinsic value to farmers • Recreational purposes • Fee-hunting/fee-recreation • Wildlife viewing • Interest rates • Higher interest rates lower land values (mid to late 1970s) • Lower interest rates higher land values (1981-1985)
Determining Farmland Value • Conversion of farmland to non-farm uses • Biggest influence on farmland values • Non-farm influence – 25% of the market value of US farmland • Happens near urban area • Government policies • Federal commodity support programs • Farm credit programs • Habitat protection laws • Environmental regulations • Infrastructure development (roads, dams)
Non-market Public Goods of Farmland • Farmland provides non-monetary benefits • “rural amenities” like recreation, aesthetic enjoyment • Areas high in amenities grow much quicker than other areas • Amenities can’t be bought or sold • Need social actions (i.e. legislation) to offset the market’s inability to account for these valued non-market goods
Non-market Public Goods of Farmland • State and local land use policies – primary means of preserving “rural amenities” • Encourage the retention of private land as undeveloped or “open space” land • Federal role is limited but expanding • Federal Agricultural Improvement and Reform Act (FAIR) protects prime/unique farmland from non-agricultural uses • Farmland Protection Program (FPP) matches funds from state and local farmland protection programs
Privately Owned Land Farm Numbers: • Maximum: 7 Million – 1935 • Major decline between 1940 – 1960 • Numbers of farms decreased but the amount of farmland did not
Farm Types: According to USDA’s Economic Research Service (ERS) • Small Family - limited resource - retirement - residential / lifestyle - farming occupation – low sales - farming occupation – high sales • Large Family • Very Large Family • Non-Family
Distribution of Conservation Program Payments • Farming occupation – High sales small farms, large family farms, and very large family farms • 75% of WRP & CRP commodity payments • Farming occupation – Low sales small farms, residential / lifestyle, and retirement farms • 25% of WRP & CRP commodity payments
Land Use Retirement Residential / lifestyle Farm-occup. – low sales Non-family 50% grazing land 25 – 33% cropland Large Very Large 50 – 60% cropland 30 – 40% grazing land
Three Keys to the Tenure / Conservation Relationship • Tenure’s impact depends on timing & magnitude of costs/returns from the conservation practice under study • Different lease arrangements influence renters’ conservation decisions • Land characteristics vary between land operated by renters and owners
Concentration of Production • Concentration of Production = more livestock on fewer farms • 1997 – 50% of farm sales came from 2% of U.S. farms & only 15% of the land • Higher concentrations raise environmental concerns: • Large livestock farms • Land absorption ability – 23% nitrogen and phosphorous • Overgrazing