MRTG and RRDTool
Network Monitoring and Management. MRTG and RRDTool. MRTG: Multi Router Traffic Grapher.

MRTG and RRDTool
E N D
Presentation Transcript
Network Monitoring and Management MRTG and RRDTool
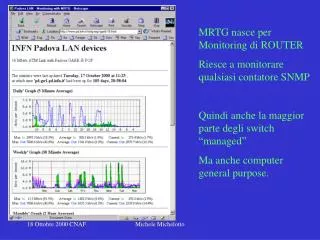
MRTG: Multi Router Traffic Grapher • MRTG is a tool to monitor the traffic load on network-links. MRTG generates HTML pages containing PNG images which provide an almost live visual representation of this traffic. You can find MRTG at http://oss.oetiker.ch/mrtg/. • MRTG has been the most common network traffic measurement tool for all Service Providers. • MRTG uses simple SNMP queries on a regular interval to generate graphs.
MRTG • External readers for MRTG graphs can create other interpretation of data. • MRTG software can be used not only to measure network traffic on interfaces, but also build graphs of anything that has an equivalent SNMP MIB - like CPU load, Disk availability, temperature, etc... • Data sources can be anything that provides a counter or gauge value – not necessarily SNMP. • For example, graphing round trip times • MRTG can be extended to work with RRDTool
MRTG: Issues • MRTG generates each graph (what if you have hundreds of graphs!) every 5 minutes, creating a lot of overhead. • It also has very few customizable graphing options. • Disk space is always an issue. • MRTG management itself can be tedious work.
Using MRTG • Get the required packages • Compile and install the packages • Make cfg files for router interfaces with cfgmaker • Create html pages from the cfg files with indexmaker • Trigger MRTG periodically from cron or run it in daemon mode
RRDTool • Round Robin Database for time series data storage • Command line based • From the author of MRTG • Made to be faster and more flexible • Includes CGI and Graphing tools, plus APIs • Solves the Historical Trends and Simple Interface problems as well as storage issues
Defining the Output (Archives) • RRA:AVERAGE:0.5:1:24 • RRA:AVERAGE:0.5:6:10 • RRA = Round Robin Archive • AVERAGE = consolidation function • 0.5 = up to 50% of consolidated points may be UNKNOWN • 1:24 = this RRA keeps each sample (average over one 5 minute primary sample), 24 times (which is 2 hours worth) • 6:10 = one RRA keeps an average over every six 5 minute primary samples (30 minutes), 10 times (which is 5 hours worth) • Clear as mud! • All depends on original step size which defaults to 5 minutes
So simple… • rrdtool create /var/nagios/rrd/host0_load.rrd -s 600 DS:1MIN-Load:GAUGE:1200:0:100 DS:5MIN-Load:GAUGE:1200:0:100 DS:15MIN-Load:GAUGE:1200:0:100 RRA:AVERAGE:0.5:1:50400 RRA:AVERAGE:0.5:60:43800 • rrdtool create /var/nagios/rrd/host0_disk_usage.rrd -s 600 DS:root:GAUGE:1200:0:U DS:home:GAUGE:1200:0:U DS:usr:GAUGE:1200:0:U DS:var:GAUGE:1200:0:U RRA:AVERAGE:0.5:1:50400 RRA:AVERAGE:0.5:60:43800 • rrdtool create /var/nagios/rrd/apricot-INTL_Ping.rrd -s 300 DS:ping:GAUGE:600:0:U RRA:AVERAGE:0.5:1:50400 RRA:AVERAGE:0.5:60:43800 • rrdtool create /var/nagios/rrd/host0_total.rrd -s 300 DS:IN:COUNTER:1200:0:U DS:OUT:COUNTER:600:0:U RRA:AVERAGE:0.5:1:50400 RRA:AVERAGE:0.5:60:43800
What it looks like… http://noc.ws.nsrc.org/mrtg/device.html
MRTG • In Ubuntu / Debian • $ sudo apt-get install mrtg • Configuration • /etc/mrtg/<device.mrtg> • Global directory : /var/www/mrtg/ • Run MRTG against the configuration file from cron
cfgmaker • Uses snmpwalk and creates an mrtg configuration file • /usr/bin/cfgmaker \--output=/etc/mrtg/router.mrtg \--global 'workdir: /var/www/mrtg’ \ --global 'options[_]: growright,bits’ \ NetManage@10.10.0.254
Sample • Part of /etc/mrtg/device.mrtg • ### Interface 1 >> Descr: 'FastEthernet0/0' | Name: 'Fa0/0' | Ip: '' | Eth: '' ### • Target[10.10.0.254_Fa0_0]: #Fa0/0:NetManage@10.10.0.254: • SetEnv[10.10.0.254_Fa0_0]: MRTG_INT_IP="" MRTG_INT_DESCR="FastEthernet0/0" • MaxBytes[10.10.0.254_Fa0_0]: 12500000 • Title[10.10.0.254_Fa0_0]: Traffic Analysis for Fa0/0 -- rtr.ws.nsrc.org.nsrc.org • PageTop[10.10.0.254_Fa0_0]: <h1>Traffic Analysis for Fa0/0 -- rtr.ws.nsrc.org.nsrc.org</h1>
Creating HTML with indexmaker • Execute indexmaker like this: • /usr/bin/indexmaker \ • --output=/var/www/mrtg/device.html \ • /etc/mrtg/device.mrtg • If your mrtg configuration file is well commented, the html is nice and detailed.
Lab Instructions • In a separate file