Download
1 / 47
480 likes | 528 Vues
Exploring how to uncover the genes behind human diseases by utilizing genetic mapping techniques. Discover the process of mapping unknown genes using known loci and SSRs, aiding in the study, diagnosis, and treatment of illnesses. ####

E N D
Lectures 30 and 31 “Identifying human disease genes” If you are interested in studying a human disease, how do you find out which gene, when mutated, causes that disease?
The one gene you are interested in could be any of the 20,000 genes in the human genome. Which one is it?
Examples of disease we’ve already discussed DISEASEGENE THAT IS MUTATED NORMALLY ENCODES: Sickle Cell Anemia Hemophilia Cystic Fibrosis
Why would you want to map one of these genes? If you find the gene, you know the protein that is affected and (often) how it is affected. -- study normal human physiology -- create diagnostic tests -- design treatments (e.g. If the normal protein is gone, can you provide it? If the normal protein is over- active, can you inhibit it with a drug?)
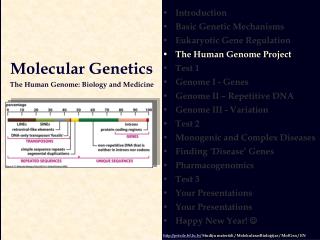
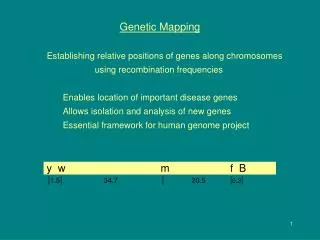
How do we identify the right gene? Each of the 20,000 genes in the human genome has a unique map position in the genome. Each gene is found at the same position in all members of our species. You can find that position by genetic mapping.
How have we done genetic mapping previously in 7.03? In flies? In yeast? In bacteria? In all of these ways, we map our one unknown locus with respect to many known loci.
Where is the unknown gene “trpX” in which you are interested? What Distance is Being MeasuredCotransduction Frequency malA to trpX 0% sucB to trpX 0% thrC to trpX 0% araD to trpX 0% ileE to trpX 10% leuF to trpX 90% lacG to trpX 20% proH to trpX 0% valI to trpX 0% nytJ to trpX 0% alaK to trpX 0% galL to trpX 0%
Why did we do mapping differently in flies, yeast, and bacteria? Flies: Yeast: Bacteria: Humans have a life cycle most similar to that of flies out of these three.
How we map in flies does have some similarity to how we map in humans Drosophila has 4 chromosomes: X, 2, 3, and 4. We ask: Is our trait on the X chromosome? If not, is our trait on chromosome 2? If not, is our trait on chromosome 3? If not, is our trait on chromosome 4? … and then narrow our search down to a chromosomal region
Why do we do mapping differently in flies and humans? 1. We cannot do controlled human crosses. 2. We do not have true-breeding strains of humans. 3. Humans do not have large numbers of offspring. There are not a lot of known single gene traits in humans that we can map in respect to. (like in flies: wing veins, eye color, bristle length, etc.)
How do we get around these things? 1. We cannot do controlled human crosses. 2. We do not have true-breeding strains of humans. 3. Humans do not have large numbers of offspring. There are not a lot of known single gene traits in humans that we can map in respect to.
What do we do given that there aren’t a lot of available traits? We don’t map with respect to known traits. We use DNA loci (like SSRs) that: -- -- --
What are these loci, such as SSRs? Regions of repeated “junk” DNA Remember, most of our DNA is non-coding DNA! *
My DNA at an SSR, for example ATCGATCGATCGATCGATCGATCGATCGATCG 8 repeats from mom ATCGATCGATCGATCGATCGATCG 6 repeats from dad
How do we test for which SSR alleles someone has? Isolate the DNA from blood or cheek cells Do PCR using primers that flank the repeated region 3. Run out the products on a gel using electrophoresis
What might the genotyping for 3 people look like? Person # More repeats = bigger piece of DNA “A” allele Fewer repeats = smaller piece of DNA “B” allele
Are these my parents? Can they be my parents? Mom Me Dad “A” allele “B” allele
What are SSRs used for? Paternity Testing Forensics Tracing human history Mapping!
How do we map in humans? Collect pedigrees in which the disease is present, and take blood samples of people Do PCR and gel electrophoresis for 100s of SSRs spread throughout the genome Do statistical analysis to determine which one SSR is the most likely to be linked to the trait locus, given the pedigree data we have. 4. Narrow in on the genes present in the genome near to that SSR, and find the right one out of these candidates
How do we map in humans? Collect pedigrees in which the disease is present, and take blood samples of people Do PCR and gel electrophoresis for 100s of SSRs spread throughout the genome Do statistical analysis to determine which one SSR is the most likely to be linked to the trait locus, given the pedigree data we have. 4. Narrow in on the genes present in the genome near to that SSR, and find the right one out of these candidates
The statistical analysis used is called “LOD score analysis” The higher the “LOD score,” the more likely it is that you saw the pedigree data because the trait locus and the SSR were LINKED than that you saw the pedigree data because the trait locus and the SSR were NOT LINKED
LOD = “log of the odds” LOD score = Odds of linked = the chance that you saw the pedigree data because the trait locus and the SSR were linked Odds of NOT linked = the chance that you saw the pedigree data because the trait locus and the SSR were NOT linked
What does a LOD score of +3 mean? What does a LOD score of –2 mean? What should you do next if you do LOD score analysis and you get a LOD score that is in between –2 and +3?
Steps of LOD score analysis An example: Huntington’s disease, a neurodegenerative disorder Inheritance: Symptoms: Onset: Incidence:
Steps of LOD score analysis Find a pedigree with a set of parents whose genotypes you know (or can infer) at an SSR and at the trait locus. e.g. the HD gene and SSR518:
Steps of LOD score analysis 2. Figure out which parent (dad, mom, or both) is the relevant parent
Steps of LOD score analysis 3. Determine which alleles the relevant parent gave to each of the children at the SSR and at the trait locus
Steps of LOD score analysis 4. Determine the “phase” of the relevant parent
Steps of LOD score analysis 5. Determine how many kids are recombinants and how many are parentals
Steps of LOD score analysis Pick a value for “theta.” We will choose 0.2 In real life, one does the calculation at all s.
Steps of LOD score analysis Calculate the odds that you saw the pedigree data because the SSR and the trait locus are linked What is the chance of getting one parental? What is the chance of getting one recombinant?
Steps of LOD score analysis Calculate the odds that you saw the pedigree data because the SSR and the trait locus are NOT linked What is the chance of getting one parental? What is the chance of getting one recombinant?
Steps of LOD score analysis Take the log of the odds LOD score = 0.22
What do you do if your LOD score is > 3? Narrow in on the region of the genome where the SSR is. Your search has now narrowed down which gene you want …from 20,000 to maybe 20! (What not to do: make an incorrect conclusion about an SSR allele and the allele conferring the disease)
What do you do if your LOD score is < 3? Try another theta value (in real life, you would try many theta values) -- what are you looking for in terms of theta? 2. Find more families and add together the LOD scores from multiple families.
LOD score analysis is a little more complicated if you don’t know the phase of the relevant parent.
Steps of LOD score analysis -- without phase 4. Determine the “phase” of the relevant parent
Steps of LOD score analysis -- without phase 5. Determine how many kids are recombinants and how many are parentals
Steps of LOD score analysis -- without phase Calculate the odds that you saw the pedigree data because the SSR and the trait locus are linked
Steps of LOD score analysis -- without phase Take the log of the odds LOD score = – 0.068 Note that this LOD score is lower than when we did know phase of the relevant parent.
Plenty of opportunity to practice LOD scores -- This year’s pset 7 -- 2004 pset 7 -- Sections next week -- Exam question archive for final exam -- Pset question archive for final exam
Remember -- a LOD score value is the result of a statistical test. It is not proof of anything. (remember chi square values)
What do you do if your LOD score is > 3? Narrow in on the region of the genome where the SSR is. Your search has now narrowed down which gene you want …from 20,000 to maybe 20! HD gene http://www.er.doe.gov/production/ober/graphics/human.jpg
How do you find the right gene, and then prove it? Look at your narrowed down region of ~20 genes. Do any of them make sense based on their wild-type function? (e.g. sickle cell anemia results when beta-globin is changed) Start with those candidates. 2. Do lots of DNA sequencing.
What are you looking for when you do DNA sequencing? -- -- -- What should you keep in mind that you might NOT find?
What would be the very best proof? (This is what is done in all other organisms.) What can human geneticists do as a substitute?
Our example -- Huntington’s Disease The HD gene encodes the huntingtin protein huntingtin has an essential function in brain development A disease model in mice has been made CAG (glutamine) repeat expansion --> toxicity http://ghr.nlm.nih.gov/gene=hd