Download
1 / 30
300 likes | 485 Vues
The Wind Chill Climatology of the WFO LSX CWA. Mark F. Britt National Weather Service St. Louis, MO. The Why and How. Gain a basic understanding of Wind Chill (WC) climatology that can help with: Answer media queries Forecasting extreme cold days.

E N D
The Wind Chill Climatology of the WFO LSX CWA Mark F. BrittNational Weather ServiceSt. Louis, MO
The Why and How Gain a basic understanding of Wind Chill (WC) climatology that can help with: • Answer media queries • Forecasting extreme cold days The Database covers 35 winters (1973/74-2007/08) of hourly temperature and wind observations from the airports at STL, COU, & UIN collected by the National Climatic Data Center (NCDC) and the Midwest Climate Center (MCC). It does not refer to any advisory or warning that was in effect.
Wind Chill • Calculates wind speed at an average height of five feet (typical height of an adult human face) based on readings from the national standard height of 33 feet (typical height of an anemometer) • Is based on a human face model • Incorporates modern heat transfer theory (heat loss from the body to its surroundings, during cold and breezy/windy days) • Lowers the calm wind threshold to 3 mph • Uses a consistent standard for skin tissue resistance • Assumes no impact from the sun (i.e., clear night sky).
Wind Chill Formula Wind Chill (ºF) =35.74+0.6215T-35.75(V0.16)+ 0.4275T(V0.16) Where: T = ambient dry bulb temperature (°F) V = wind speed (mph)
A Few Definitions • Advisory Criteria: -15o to -24o F • Warning Criteria: < -25oF • Headlines: Either Advisories or Warnings • Days: Calendar Days in UTC
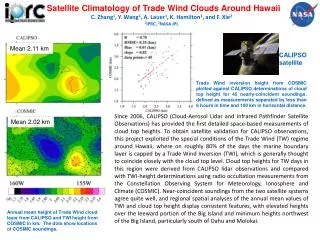
Composites Mean composites of several variables (500mb height, 850mb height and temperature, as well as 1000mb temperature, and precipitation rate) were generated using the North American Regional Reanalysis Dataset from the NOAA/ESRL Physical Sciences Division, Boulder Colorado. (http://www.cdc.noaa.gov). Composites include 20 separate days valid when advisory or warning criteria were met. • Twenty days were chosen between 1985 and 2005 when UIN had a minimum wind chill between -15 and -20°F (i.e. advisories). • Twenty days were chosen between 1979 and 2003 when UIN had a minimum wind chill < -25°F (i.e. warnings).
Composites 500 mb Heights Advisory Warning
Composites 850 mb Heights Advisory Warning
Composites 850 mbTemperatures Advisory Warning
Composites 1000 mbHeights Advisory Warning
Composites 1000 mbTemperatures Advisory Warning
Summary • For the past 35 winters, the three coldest wind chill years occurred in the late ’70s. • Our “Wind Chill Season” lasts from November to March, with headlines required from December to early March. • On average, STL will require 3 advisories and 1 warning per year.
Summary • For the past 35 winters, the three coldest wind chill years occurred in the late ’70s. • Our “Wind Chill Season” lasts from November to March, with headlines required from December to early March. • On average, STL will require 3 advisories and 1 warning per year.
Summary • The coldest wind chills occur at night. • Temperature appears to be a bigger discriminator for advisories vs. warnings than wind speed. • Wind chill headlines tend to occur with west or northwest winds.
Summary • Composite means depict northwesterly flow at 500mb between a polar vortex over southeastern Canada and ridging over western North America. • Temperatures at 850mb and 1000mb are noticeably colder during warning days than advisory days. • Northwesterly flow is noted near the surface with high pressure is centered over the central plains.