Download

1 / 24
240 likes | 659 Vues
A GIS Analysis of Boston Harbor and the Charles River Boston, Massachusetts. Amy Townsend-Small GIS in Water Resources Fall 2001. The Boston skyline as seen from the Charles River. Historical Background.

E N D
A GIS Analysis of Boston Harbor and the Charles RiverBoston, Massachusetts Amy Townsend-Small GIS in Water Resources Fall 2001 The Boston skyline as seen from the Charles River
Historical Background • The Boston Tea Party may have been the first recorded incident of the pollution of Boston Harbor, but unfortunately it wasn’t the last. • The City of Boston dumped sewage sludge and treated sewage into the harbor for over 100 years. • In the 1988 presidential election, the Democratic candidate, Michael Dukakis, then governor of Massachusetts, was criticized for what Republican candidate George Bush called “the dirtiest harbor in the world”. Artist’s rendition of the Boston Tea Party, 1773 President Bush’s comments led to the creation of several state agencies to clean up Boston’s waterways. I’ll be presenting the results of those clean-up efforts.
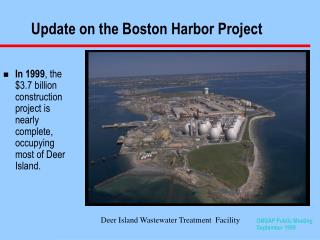
Monitoring the Pollution of the Waters of Boston Harbor In 1998, sewage discharge was stopped at the Nut Island STP and its sewage was pipelined to the Deer Island STP, where it was discharged into the harbor. The Massachusetts Water Resources Authority collected the following data before and after the transfer: Nitrogen concentration Phosphorus concentration Chlorophyll-a concentration Dissolved oxygen saturation Fecal coliform bacteria counts Water clarity An excess of nutrients like nitrogen and phosphorus can lead to eutrophication of aquatic systems, characterized by microalgae blooms and high dissolved oxygen saturation.
Dissolved Inorganic Nitrogen in Boston Harbor Before After Concentrations of DIN decrease after the transfer of sewage effluent to the new site
Total Nitrogen in Boston Harbor • Concentrations of total nitrogen decrease after the transfer of sewage effluent to the new site Before After
Dissolved Inorganic Phosphorus in Boston Harbor Before After Concentrations of DIP increase after the transfer of sewage effluent to the new site
Total Phosphorus in Boston Harbor Before After Concentrations of total phosphorus increase after the transfer of sewage effluent to the new site
Chlorophyll-a in Boston Harbor After Before Standing stocks of chlorophyll-a increased after the transfer of sewage effluent to the new site
Dissolved Oxygen in Boston Harbor Before After Dissolved oxygen decreased in saturation after the transfer of sewage effluent to the new site
Fecal Coliform in Boston Harbor Before After Fecal coliform counts decreased after the transfer of sewage effluent to the new site
Water Clarity in Boston Harbor Before After Water clarity improved after the transfer of sewage effluent to the new site
Summary of Water Quality Changes in Boston Harbor Phosphorus and chlorophyll-a increased in concentration Nitrogen, dissolved oxygen, and fecal coliform decreased in concentration, and water clarity increased. Whale watchers in Boston Harbor
Heavy Metal Contamination in the Sediments of Boston Harbor In addition to dumping sewage effluent, Boston also disposed of sewage sludge into the harbor for over 100 years. In 1991, this practice was stopped altogether. Sewage sludge is high in heavy metals such as iron, copper, and lead. How has the concentration of these metals in sediments changed since 1991?
Lead in Boston Harbor Sediments 1991 1998 Generally, lead concentrations decreased in the former sludge dumping site and increased in the site closer to shore.
Copper in Boston Harbor Sediments 1991 1998 Copper concentrations in the sediments decreased in the former sludge dumping site, and copper concentrations increased in the site closer to shore.
Iron in Boston Harbor Sediments Again, iron concentrations decreased in the former sludge dumping site and increased in the site closer to shore.
Summary of Changes in Metal Content of Harbor Sediments Logan Airport Since the metal content decreased in the former sludge dumping site, the cessation of sludge has improved harbor conditions. However, there seems to be another source of metals to Boston Harbor. Charles River
Pollution of the Charles River The Charles River is the largest river that discharges to Boston Harbor. It is also an important recreational resource for the city. However, it is dangerous to swim in because of high bacteria levels. In 1995, the EPA declared its goal to make the Charles swimmable by 2005. Their efforts have included picking up trash, the creation of sewage treatment plants in towns along the river that relied on aging septic systems, and sustainable development of communities in the watershed How has water quality changed in the Charles River?
Total Phosphorus in the Charles River • There is a slight increase in total phosphorus levels in the Charles River between 1997 and 2000. 1997 2000
Total Nitrogen in the Charles River 1997 2000 There was a general decrease in nitrogen in the Charles River from 1997 to 2000
Chlorophyll-a in the Charles River 1997 2000 There was a marked decrease in chlorophyll-a concentrations from 1997 to 2000
Fecal Coliform in the Charles River 1997 2000 Fecal coliform levels stayed about the same in the Charles River from 1997 to 2000
Summary of Changes in Water Quality of the Charles River There was a slight increase in fecal coliform counts and phosphorus in the Charles from 1997 to 2000. There were major improvements in nitrogen and chlorophyll-a levels in the Charles from 1997 to 2000. A new bridge, part of Boston’s Big Dig, crosses the Charles downtown
References Taylor, D. 2001. Comparison of water quality in Boston Harbor before and after inter-island transfer. Boston: Massachusetts Water Resources Authority. Report ENQUAD 2001-09. 104 p. Zago, C., Giblin, A.E., and Bergamasco, A. 2001. Changes in the metal content of surficial sediments of Boston Harbor since the cessation of sludge discharge. Marine Environmental Research, vol. 51, pp. 389-415. Charles River Watershed Authority, www.crwa.org A dog enjoys a day by the banks of the Charles