Exploring Stars: Spectra, Classifications, and Stellar Evolution through Hubble's Eyes
This article delves into the fascinating world of stars, examined through the Hubble Space Telescope. It defines a star, discusses the different types of spectra produced by stars, and how these spectra reveal essential information about their composition, temperature, and other characteristics. The article also covers the classification system of stars based on temperature and luminosity, including O, B, A, F, G, K, and M spectral classes. Additionally, it examines the H-R diagram, illustrating the relationship between luminosity and temperature, and concludes with insights into stellar evolution and life cycles.

Exploring Stars: Spectra, Classifications, and Stellar Evolution through Hubble's Eyes
E N D
Presentation Transcript
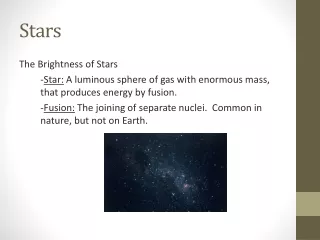
Stars – 1. Definition- a large gaseous body that generates energy through nuclear fusion in its core ( Although the term is often also applied to objects that are in the process of becoming stars or to the remains of stars that have died.) 2. Spectra (light) of Stars- - Allows astronomers to determine the star’s a. Composition b. Temperature c. Luminosity d. Velocity and Rotation rate in Space e. Mass There are three different types of spectra produced when light is passed through a prism depending on the source of the light:
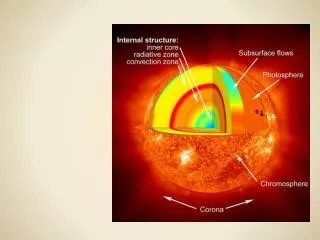
Stars (cont.) 2. Spectra (light) of Stars(cont.) A. Continuous Spectra- produced by a glowing solid, liquid, or very high density gas under certain conditions. (A normal light bulb produces a continuous spectra.) B. Absorption Spectra (Dark Line)- produced when a cooler gas lies between the observerand the object emitting a continuous spectra. - The gas absorbs some of the wavelengths of light leaving behind dark lines. The wavelengths absorbed depends on the composition of the gas and the temperature of the light source. -This is the spectra used to classify stars
Stars (cont.) 2. Spectra (light) of Stars(cont.) C. Emissions Spectra (Bright Line) – -produced when a glowing gas emits energy at specific wavelengths, characteristic of the element composing the gas. - used to study nebulae (Clouds of gas)
Stars (cont.) 3. Classifications of Stars- - Stars are essentially all made of the same material!!! - So WHY don’t they all have the same color or absorption line spectra? ***The spectral difference is due to the difference in temperature of the star. The different temperatures also leads to the difference in colors that we see: - Hotter stars appear Blue - Cooler Stars appear Red A. Classification system The classification scheme used today divides the star up into seven major spectral or temperature classes O, B, A , F, G , K, M (Oh Be A Fine Girl (Guy) Kiss Me O – Hottest Stars M – Coolest Stars
The Spectral Sequence Spectral Class Temperature Color Spectral Lines Example O 30,000 to 50,000 K Blue-Violet Ionized Helium Minataka B 11,000 to 30,000 K Blue-White Neutral HELIUM, Hydrogen Rigel, Spica A 7,500 to 11,000 K White Hydrogen (Strong) Sirius, Vega F 5,900 to 7,500 K Yellow-White Ionized Metals Procyon G 5,200 to 5,900 K Yellow Ionized CALCIUM, Ionized and Neutral Metals The Sun, Capella K 3,900 to 5,200 K Orange Neutral Metals Arcturus, Aldebaran M 2,500 to 3,900 K Red-Orange Neutral Metals, Molecular Bands Betelgeuse, Antares
Stars (cont.) 3. Classifications of Stars (cont)- A. Classification system (cont.) Since 1995 Astronomers have found new stars with surface temps even lower than spectral class M. These bodies which are not truly stars are called Brown Dwarfs- Heat is generated by contraction of gases not Nuclear Fusion. (Give off a lot of light in the infrared range.) B. H-R Diagram (Hertzsprung + Russel) - In 1912 classification scheme for stars invented - Stars are plotted according to: 1. Luminosity (Absolute Magnitude) Brightest Stars at the Top 2. Temperature (Spectral Class) Hotter Stars on the Left – Temperature Decreases as you move to the right
H-R Diagram of Some of the Most Prominent Stars in the Night Sky
Stars (cont.) 3. Classifications of Stars (cont)- B. H-R Diagram (cont.) 3. Super-giants: - Very few rare stars that are bigger and brighter than typical giants - 1000 times larger than the Sun EX- Betelguese in Orion and Antares in Scorpius 4. White dwarfs- - Remaining 9% of stars located in the lower left of the H-R Diagram - Although Very Hot, they have low luminosities due to their small size.(About the size of Earth) - (So dim can only be seen with a telescope) **- NO nuclear Fusion in core, only shines due to stored heat remaining from contraction of core. EX- Sirius B a companion star to Sirius A.
Stars (cont.) 3. Classifications of Stars (cont)- B. H-R Diagram (cont.) - Data points (Stars) on the diagram are NOT scattered randomly, but rather appear grouped in a few distinct regions: 1. Main Sequence Stars: - About 90% of stars fall in this band stretching diagonally across the diagram. -Extends from the hot, luminous blue stars to the cool, dim red stars Ex- Sun is a Main sequence star 2. Giants: - Upper right hand side of diagram - Stars are both luminous and cool. In order to be as luminous as they are they must be large or giants - Approximately 10 to 100 times larger than our Sun Ex- Aldebaran in Taurus
Stars (cont.) 4. Stellar Evolution- - Stars DO NOT Live forever - Eventually the fuel which powers the nuclear reactions will run out and the star will cease to shine. - Changes that a star undergoes is referred to as its LIFE CYCLE A. Pre-Main Sequence Stage Star - Stars form in a dense cold, cloud of dust and gas (Mostly Hydrogen and Helium) called a Cocoon Nebula that begins to condense and form a Proto-star Possible Reasons for Condensation- a. Nearby Supernova Outburst b. Stellar Winds from hot nearby stars 1. Proto-Star- Forms as the cloud condenses by the gravitational accretion of gas and dust. As it grows the contraction of the particles causes it to heat and begin to glow.
Stars (cont.) 4. Stellar Evolution (cont.) A. Pre-Main Sequence Stage (cont.) 2. Protostar(cont.) - As protostar begins to heat and glow, it spins faster. Which starts Bipolar Outflow - NO FUSION YET – Heat only generated by contraction - Evidence of star formation: a. T-Tauri Stars b. Herbig-Haro Objects- Bipolar outflow collides with surrounding interstellar medium c. EGG’s (Evaporating Gaseous Globules) smalll dense clouds in the act of contracting d. Protoplanetary disks (PROPLYDS) - If you see any of these there would most likely be a star forming there, but no planets and no fusion yet!!!!
Collapse of an Interstellar Cloud and Formation of many Stars
Herbig Haro Object- Shows Bipolar flow colliding with interstellar medium 27
The Eagle Nebula – Possible formation of Many stars. Example of an EGG 29
Protoplanetary Disk- Photo taken by Hubble Space Telescope 31
Stars (cont.) 4. Stellar Evolution (cont.) A. Pre-Main Sequence Stage (cont.) 2. Protostar(cont.) -Eventually contraction of gasses produces a high enough temperature at the core so that Nuclear Fusion Starts. ***-Once Hydrogen fusion begins A MAIN SEQUENCE STAR IS BORN -Time frame for formation: A. The more mass there is, the more heat generated by contraction, the faster the Star forms (15- solar masses takes about 60,000 years to form) B. The less mass there is, the less heat generated by contraction, the slower the star forms ( .5 solar masses takes 150 million years to form) C. Our sun probably took about 50 million years to form
15MSun 9MSun 3MSun 1MSun 0.5MSun 34
Stars (cont.) 4. Stellar Evolution (cont.) B. Main Sequence Stars- - Once Hydrogen fusion begins the temperature and pressure in the core become strong enough to resist further contraction ***- Hydrostatic Equilibrium is reached and the star becomes a stable Main sequence Star
Hydrostatic Equilibrium – The outward pressure of Nuclear Fusion is EQUAL to the inward Pull of Gravity Our Sun- A Main Sequence Star
Stars (cont.) 4. Stellar Evolution (cont.) B. Main Sequence Stars (cont.)- - Time frame for Main sequence Star: 1. More Massive Stars have to burn hotter and faster to resist gravitational contraction and therefore use up their fuel quicker. ( A 15 solar mass star will burn for about 10 million years) ** Higher internal temps makes these stars more luminous 2. Less massive stars burn cooler and therefore can last longer ( A .5 solar mass star will live for 100 billion years) ** Low temps mean they are NOT as luminous 3. Our Sun will fuse hydrogen (burn) for about 10 billion years
Stars (cont.) 4. Stellar Evolution(cont.) B. Main Sequence Stars (cont.)- - The short life span of massive stars implies that observed ones MUST be YOUNG!!! -> Would you expect to find Life around planets that orbit these massive stars??? C. Post Main Sequence Stage- - Core’s Hydrogen supply runs out Fusion stops and core begins to contract under gravity. - The release of heat from contraction causes outer layers of hydrogen to fuse at an incredible rate and outer layer expands to become a RED GIANT STAR 1. Red Giant or Super-giant: Very luminous due to its size but heat is spread out over a larger area so cooler than main sequence star….That’s why it turns red!!! Ex- Betelguese in Orion is a Star that has left the Main sequence stage and become a Red Supergiant.
Size of Supergiant, Betelguese, compared to orbit of Earth and Jupiter 44
Stars (cont.) 4. Stellar Evolution (cont.) C. Post main Sequence Stage (cont.) what happens to a star after Fusion stops depends on the original mass of the star. a. Low mass stars such as our sun will become Red giants b. Higher Mass stars will expand much further to become Red Super-giants. (ex- Betelguese)
Stars (cont.) 4. Stellar Evolution (cont.) D. Death of a Star – 4 Solar Masses or less - Core of Red Giant will heat up due to contraction and start fusing helium to carbon at a very high rate. - When Helium runs out Fusion stops and Carbon Core begins to contract which again causes outer layers to heat up and expand. - Outer layers of gas will be ejected into space to form a Planetary Nebula: a huge shell of brightly glowing gas and dust lighted by the very hot exposed core of a star. (Will become White Dwarf Star)
Instability of the envelope of gases that surround a Red Giant Star
Stellar Evolution of a Star like our Sun Represented on a H-R Diagram