Perkins IV Data and Accountability
330 likes | 368 Vues
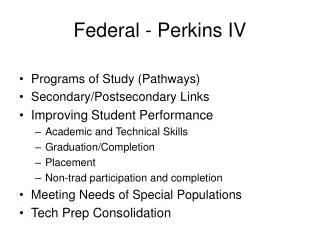
Learn the key definitions, data system, and core indicators of Perkins IV in CTE programs, debunk myths, and understand accountability. Get insights on reporting data effectively for performance indicators.

Perkins IV Data and Accountability
E N D
Presentation Transcript
Perkins IVData and Accountability PERKINS DATA California Department of Education
Goals 1. The Big Picture 2. Perkins Definitions 3. Perkins Data System 4. Core Indicators - Data Needed 5. Error Checking/Review
The Big PictureThe Little Pieces • Approved Perkins Application & Local Plan • CTE Sequence of Courses • CTE Course & Codes (code #, nontrad) • Perkins Data System (E1, E2, CDE 20 & 21) • CALPADS • Student Status (grade level, pathway, gender)
The Big PictureMyth Busters • Perkins Data System reports on prior year data. • CALPADS reports on current year data. • Perkins allocations for 131 (secondary) are based on K-12 enrollment + low income students. • Perkins allocations for 132 (adult) are based strictly on the CDE 20 & CDE 21.
Accountability Definitions • CTE Participants • CTE Concentrators • 12th Grade Student • Completers (CALPADS only) • Capstone Course • Non-traditional gender groups enrollment /courses
Secondary Student Definitions • Participant: A secondary CTE participant is a student who has been enrolled in any CTE course. • Example: Any student who has been enrolled in a CTE course should be counted as a CTE Participant including all concentrators.
Secondary Student Definitions • Concentrators: A secondary CTE concentrator is a student who has completed 50 percent of a planned program sequence (in hours or credits) in a state-recognized CTE sequence and is enrolled in the next course in that sequence, or has completed 50 percent of a single state-recognized multi-hour course and is enrolled in the second half of that course. • Example: Any student who is in a second or third course sequence and students enrolled in the last course would be counted as concentrators. In a four course sequence, students enrolled in the third course would be counted as concentrators.
Adult Student Definitions • Participant: An adult CTE participant is a student who has completed at least 20 hours of instruction in a CTE course that is at least 20 hours or more in duration. • Example: Courses less than 20 hours in duration would not count. Students who attended less than 20 would not be counted as a participant.
Adult Student Definitions • Concentrator: An adult CTE concentrator is a student who has completed 50 percent of a planned program sequence (in hours or credits) in a state-recognized CTE sequence and is enrolled in the next course in that sequence, or has completed 50 percent of a single state-recognized multi-hour course and is enrolled in the second half of that course.
Other Definitions • 12th Grader – based on your CALPADS enrollment data. • Completers (CALPADS) – CTE Pathway Completers = concentrators who completed the pathway. • Capstone Course - the last course in a planned sequence of CTE courses necessary for employment in an identified occupation.
Definitions (cont.) • Non Traditional Courses – Working in a field or pursuing a degree program in which the total population is comprised of 25% or less of one gender. • Economically disadvantaged-individuals from economically disadvantaged families, including foster children.
Reporting the Data Two required reports used to gather the data necessary to calculate the Core Indicators of Performance of the Career Technical Education (CTE) Program at the local level. • The CDE 101 E1 – annual report of prior year CTE enrollment. • The CDE 101 E2 – annual report on placement of prior year CTE students six months after graduation.
Data Needed Check your Student Information System (SIS) for: 1. All CTE Programs. 2. All courses are identified from the Local CTE Plan. 3. Report all CTE courses regardless of current year funding. 4. Identify each course as either a Participant, Concentrator or Concentrator/Capstone Course.
Data Needed (cont.) Review the available reports from the SIS relating to Perkins IV. - Generate a report to identify courses codes - Pull ethnicity and special populations data. - Ensure that 12th grade concentrator records contain: • Graduation Information • Grade of last CTE course • CAHSEE scores.
Data Needed (cont.) • Perkins IV requires that all grade 12 CTE concentrators who score Proficient or Advanced be reported on the E1. – Proficient is a score of 380 or above – Do not report grade 12 CTE concentrators who passed. A passing score is 350. – CAHSEE scores are sent to each LEA approximately 7 weeks after each test administration on the Student Detail file CD from ETS.
The Perkins Data System • Each Perkins grantee has a “data” person. • Separate Logon & Password. • Reports Perkins data in October and March to meet requirements. • Data feeds into the Perkins Core Indicators. • Core Indicators are reflected on the annual Perkins application.
Reporting E1/E2 Timeline • E1 – July 1 – October 15: • Report on previous year enrollment • E2 – March 1 – May 15: • Follow-up on placement of previous year concentrators
Reporting CDE 20/21 Timeline • No on line reporting / paper only – faxed to CDE. • CDE 20 – due by October 31 – CTE enrollment of economically disadvantaged unduplicated students. • CDE 21 – due by March 31 – CTE enrollment in Adult Education and ROCPs.
Quick Tutorial of the System • Accessing the system • Entering Data • Manual Entry • Electronic Upload • Adding/Deleting Courses • Data Review • Upload Process / Final Submission
Districts Reporting ROCP Data • Starting on the current report, ROCP enrollment was collected from the Local School districts. There are two issues: • First, the true picture of how the Seniors are doing is not complete unless both are reported by the "District". The ROCPs report to the CDE, but the ROCP do not report by district. This means the CDE cannot capture the ROCP students from the local district from the county ROCP. • Secondly, Perkins IV requires the CDE report Academic Attainment for Seniors. For California, this is a Proficient (380) score on the CAHSEE. Student CAHSEE scores are not shared with the ROCP and this means that the CDE again cannot get this from the ROCPs.
Core Indicators • Review of the measures • How the data is used by CDE • Implications for not meeting targets • Need improvement agencies – follow up • Priority improvement agencies • Monitored agency
Adult Indicators • 1A1 – Technical Skill Attainment – number of students who passed the assessment. • 2A1 – End of Program Certification, Degree, or Credential. • 4A1 – Placement Report. • 5A1 – Non-Traditional participation • 5A2 – Non-Traditional completion
Core Indicators • CDE will calculate rates for each measure by agency and will determine the numbers and rankings of districts scoring below the overall annual state performance-level targets in 10 percent increments for all agencies.
Implications of Core indicators • Agencies meeting or exceeding 90 percent in all of its annual performance-level targets will be considered to be in compliance with Perkins accountability requirements.
Needs Improvement Agency • Agencies falling below 90 percent on any of its annual performance-level targets will be considered a Needs Improvement Agency. • Required to submit a Program Improvement Form to be submitted with the annual application which: • Describes the planned strategies and activities to be employed during the upcoming year to bring performance levels to the 90 percent compliance mark.
Priority Improvement Agency • Agencies scoring below 90 percent in three or more of the its annual performance-level targets or • Scoring below 60 percent on any single performance-level target
Priority Improvement Agency • Requires a detailed Action Plan separate from the application which includes: • A diagnosis of the causes of low performance and description of the strategies planned to reach 90 percent. • The expected outcomes, funding dedicated to each strategy and date of completion expected for each strategy. • May request technical assistance from the CDE. • Will be visited by CDE staff at least once during the year to validate progress and provide technical assistance.
Priority Improvement Agency • Exits priority status when performance improves to Needs Improvement Agency status. • Agencies remaining in Priority Improvement Status for four years will become a Monitored Agency.
Monitored Agency • Agencies scoring in the lowest percentage of overall performance as determined by a composite ranking of all performance-level measures. • Will be subject to Perkins Program Monitoring (PPM). • Will be subject to PPM as specified annually by the Joint Advisory Committee for Career and Technical Education (JACCTE) including actions and sanctions as specified in the State CTE Plan. (State Plan, Appendix K)
Data Review Use the Summary Reports: - Reality Check - Make necessary corrections - If your numbers are within 90% your LEA will be meeting the targets for Data reporting. - 0% or 100% or N/A raise flags for audit purposes