Download
1 / 16
160 likes | 465 Vues
Raman spectra and X-ray diffraction of Boron Triiodide at high pressure. SHIMIZU Group ONODA Suzue. Ref: A. Anderson and L. Lettress J. Raman Spectrosc. 2002; 33 : 173. Contents. Introduction ・ Structure of boron triiodide ・ Pressure effect Experiment Results and discussions

E N D
Raman spectra and X-ray diffraction of Boron Triiodide at high pressure SHIMIZUGroup ONODASuzue Ref: A. Anderson and L. Lettress J. Raman Spectrosc. 2002; 33: 173
Contents • Introduction ・Structure of boron triiodide ・Pressure effect • Experiment • Results and discussions • Summary
B molecule: planar triangle structure (平面三角形分子) I crystal structure: hexagonal (space group P63/m) Structure of BI3 molecules are layered to c-axis unit cell
The decrease in volume or atomic distance change of atomic orbital and energy band structure diatomic molecular crystal pressure Pressure effect covalent bond molecular dissociation (分子解離) molecular orbital monatomic metal van der Waals bond molecular crystal / insulator
15 pressure 16 (GPa) I Sn triangular ? BI3 ・structural transition ・metallization ・molecular dissociation … etc. B I Motivation metallization molecular dissociation linear superconductor orthorhombic I2 fcc 7 30 22 tetrahedral 21 amorphous cubic superconductor SnI4 fcc-like
Experiment 1 Raman spectroscopy ・Sample were loaded into a diamond anvil cell (DAC) of the piston-cylinder type using a glove-bag with an argon atmosphere. ・A few grain of ruby powder were included for pressure measurements. ruby sample gasket (inconel) 120μm 300μm
ν0+νR ν0 ν0-νR Intensity (arb.units) Raman shift (cm-1) Raman scattering 24.7 GPa (×400) 11.3 GPa (×200) ν0 (Rayleigh scattering) 5.3 GPa (×30) νR ν0±νR:Ramanscattering (νR›0) νR:Raman shift 1.6 GPa 1 atm S.Sugai., J. Phys. C: Solid State Phys., 18, 799 (1985)
Raman spectra intramolecular mode ν1: symmetric B-I stretch mode ν4: degenerate in-plane bend mode Intensity (arb.units) Lxy Txy ν4 ν1 intermolecular mode Raman shift (cm-1) Lxy: libration about in-plane axes Txy: in-plane translation (a)1.3 GPa (b)2.3 GPa (c)4.1 GPa
The spectra evolve smoothly, with no obvious discontinuities. ν1 ・no evidence of any structural phase transitions ・no indication of any major distortion of BI3 molecules ν4 Raman shift (cm-1) ν1 ν4 intramolecular modes: modest increase Lxy Txy Lxy Txy intermolecular modes: dramatic increase The intermolecular forces are greatly affected by external pressure Pressure (GPa) Pressure dependence of Raman shift *The data points for all modes have been fitted to linear function.
Experiment 2 X-ray diffraction at SPring-8 BL04B2 (my work) ruby sample gasket (stainless steel) lever-arm diamond anvil cell 60μm 600μm
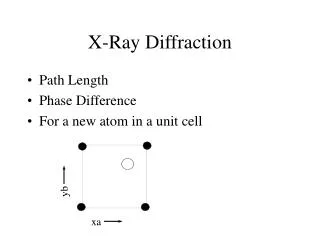
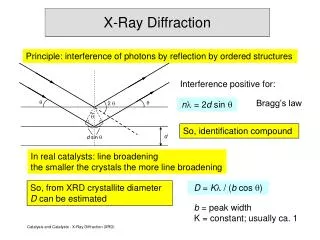
λ dhkl Bragg’s law 2dhklsinθ=λ dh’k’l’ θ dhkl: spacing of lattice planes X-ray diffraction
:new peak X-ray diffraction pattern (e)15.3 GPa From diffraction pattern・・・ ・(a) and (b) :typical diffraction patterns for hexagonal (phase Ⅰ) ・(c): two phases (phaseⅠand Ⅱ) coexist ・Above 9 GPa, the peaks of phase Ⅰ disappear and there is single phase(Ⅱ) indexed with the fcc (face centered cubic). 111 200 220 311 (d)9.14 GPa 222 fcc Intensity (arb.units) (c)6.96 GPa (b)5.74 GPa hexagonal 111 300 (a)3.16 GPa 110 221 302 112 2θ(degrees) (λ=0.32964 Å)
4 5 1 3 1’ 3’ 2 Distance between iodine atoms (Å) r(fcc) : most nearest I-I distance intralayer I-I r(fcc) continuously r(fcc) interlayer I-I discontinuously Pressure (GPa) r(1-2): constant *assumption: molecules are rigid molecular dissociation r(fcc) : shorten by compression Pressure dependence of atomic distance (層内) (層間)
At metallization・・・ Distance between iodine atoms/Å Pressure/GPa Discussion ・In case of iodine, the nearest interatomic distance rI-I(I2) is 3.6Å at 16 GPa. ・rI-I(SnI4) is also 3.6Å at 7 GPa. ref. 高圧力の科学と技術 15, 120 (2005) Metallization of BI3 may occur at about 11GPa.
metallization molecular dissociation linear I2 7 pressure 16 21 (GPa) I Sn triangular BI3 B I Discussion orthorhombic fcc tetrahedral cubic SnI4 fcc-like 7 GPa hexagonal fcc ~11 GPa
From Raman spectra・・・ ・The original crystal structure appears to be stable over the pressure range 0-5 GPa. ・The molecular identity is retained and no major distortions occur. From X-ray diffraction・・・ ・Structural transition to fcc phase appears at 6.9 GPa. ・In phase Ⅱ(fcc), molecular dissociation occurs. ・Metallization may occur about 11 GPa. In future・・・ I will measure electric resistivity to confirm metallization. Summary