Download
1 / 17
170 likes | 199 Vues
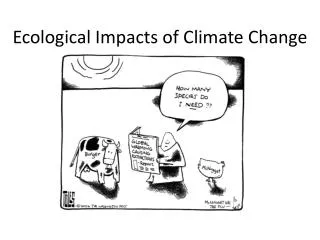
Explore physiological implications of climate change on species distribution and ecosystem dynamics using remote sensing technologies. Investigate the influence of temperature on commercial shellfish activity and population connectivity. Understand the role of ecosystem engineering species in shaping assemblages. Consider the failures and limitations of niche conservatism in species distribution models. Analyze the effect of storms on biogeography and temperature fluctuations on commercial clam habitats. Collaborate with fisheries for short-term temperature forecasting. Study the biogeography of ecosystem engineers and predict changes in nutrient fluxes under climate scenarios.

E N D
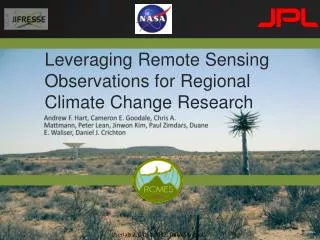
Physiological Impacts of Climate Change Using Remote Sensing David S Wethey, Sarah A Woodin, Thomas J Hilbish, Venkat Lakshmi University of South Carolina Brian Helmuth, Northeastern University wethey@biol.sc.edu
Biogeographic Modeling • Ecosystem engineering species that control the rest of the assemblage • competitive dominants • sediment stabilizers • sediment destabilizers • Age structured metapopulation • Reproduction controlled by Sea Surface Temperature • Gridded ICOADS temperatures • 1850-present • Dispersal • 10% N, 10% S • 10 km max • Seed entire coast with species in 1850 and allow population distribution to evolve over time
Hindcasts of Geographic Limits (lines) and Historical Records of Limits (dots) Wethey et al. 2011. J Exp Mar Biol Ecol 400:132-144
Effect of Ocean Model on Estimates of Population Connectivity NEMO – UK Met Office & Spain Puertos del Estado Hycom – US Navy & French Navy MARS - IFREMER Pingree & Griffiths Model with same winds
Species Distribution Modeling • Correlative niche models • Mechanistic niche models • These models assume that mechanisms and patterns found in one geographic region or epoch can be used to predict distribution in another. This is the concept of niche conservatism, model stationarity or model transferability.
Can physiology inform species distribution models? • Examine difference between lethal vs performance limits • Thermal death vs scope for growth / energy budget • Commercially important shellfish • Extensive physiology, production, biogeography data • Extremely important to find reasons for failure of assumption of niche conservatism in species distribution models that work in one geographic region but fail to make correct predictions elsewhere. Species Distribution Model Based On Thermal Tolerance Marine mussel Mytilusedulis Distribution Model Validated for US East Coast Fails utterly in Europe Woodin et al. 2013 Ecology & Evolution 3:3334-3346
Models are likely to fail if ecological performance limits are different from physiological tolerance limits, and environmental variance differs between regions TEM = transient event margin CTmax= physiological performance limit LTmax= lethal temperature Woodin et al. 2013 Ecology & Evolution 3:3334-3346
Scope for growth and biogeography of commercial mussels in Europe Fly & Hilbish 2013. Oecologia 172:35-46
Scope for Growth Models incorporating daily SST and Satellite Chlorophyll yield the approximate southern limit of Mytilusedulis in Europe Chlorophyll µg/L End of Year body mass via SFG Fly et al. in press
Mussel Thermal Projections in Europe M galloprovincialis M edulis Present climate Fraction of years hotter than threshold RCP 4.5 2046-2050 Fraction of models predicting years hotter than threshold RCP 4.5 2096-2100 Primary source of mussel seed for Europe will no longer exist Fly et al. In press
Effects of storms on biogeography? Waves in 2014 Diopatra Range Edge Low Recruitment North of here Sennen Cove, Cornwall, 2014
Effect of Temperature on activity of commercial clams in Spain Porewater pressure dynamics due to burrowing Pressure Pulses per Hour R decussatus Ameixafina € € Rphilippinarum Ameixaxaponesa € R pullastra Ameixababosa € € € Decussatus increased activity 32°C Philippinarum increased act up to 36°C Pullastra reduced activity 32°C died 36°C
Collaboration with fisheries cooperatives in Galicia (NW Spain) Short-term forecasting of temperatures in commercial intertidal clam beds Ría de Arousa – most important grow-out region in Spain 5 km Short term intertidal temperature forecasts 1km WRF meteorological model (Meteo-Galicia) 250 m MOHID ocean model (Meteo-Galicia) NOAH intertidal sediment land surface model 3-day forecasts of risky conditions Advance warning of die-offs
Whangateau Harbor Cockle Mass Mortality 2009 Forecasts of intertidal temperatures 2007-2010 High cockle mortality occurred during unusually hot conditions in the intertidal: >35°C at 1cm depth in sediment Cockle data: Karen Tricklebank
Biogeography of Ecosystem Engineers in NZ Macomonalilliana clam– dominant contributor to benthic-pelagic coupling Decadal rates of change CART Model of SST NIWA field data Hadley Centre CMIP 5 Forecasts HISST 1900-2000 RCP 4.5 Macomonadensities low if winters hotter than 14°-15°C Maps are fractions of winters above 15°C in a decade Average fractions based on 20 GCMs RCP 4.5 All time series adjusted for 2006-2012 SST bias Expect large reduction in benthic nutrient fluxes by mid century in North Island 2006 2016 2040 2050 2090 2100 Min SST Mean SST Max SST
Summary • Ecosystem engineers and commercially important species moving poleward • Consequences for mariculture, nutrient fluxes, community composition • Important to consider physiological performance in species distribution models • Metapopulation approach is very powerful • BUT need to be very careful in estimating connectivity • Model stationarity/transferability related to physiological performance and environmental variability • All models are hypotheses • Don’t trust any individual model – use ensembles