Download
1 / 37
390 likes | 540 Vues
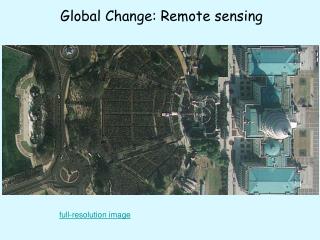
Global Change: Remote sensing. full-resolution image. Global Change: Remote sensing. Imagery: small scale (coarse) resolution – large area. Visit September Sea Ice Concentrations for an animation of September sea ice concentrations 1979 -2010. Changes in snowmelt, Greenland

E N D
Global Change: Remote sensing full-resolution image
Imagery: small scale (coarse) resolution – large area Visit September Sea Ice Concentrations for an animation of September sea ice concentrations 1979 -2010.
Changes in snowmelt, Greenland High resolution: Jakobshavn Glacier http://earthobservatory.nasa.gov/IOTD/view.php?id=44625
2010 tied with 2005 as the warmest year since global records began in 1880
Kilimanjaro: 1993 and 2000“ice predicted to disappear by 2010”new estimate: 2030
Introduction Remotely sensed satellite imagery is suitable for monitoring changes, with regular orbits Repeat period = 1- 20 days ...subject to cloud cover and scale There are few satellite 'photos' - they are images, captured along scan paths. e.g. Earthnow(this webpage app needs Java) Early earth monitoring satellites were launched by NASA, but now many from other countries (and corporations). Types vary according to:
1. Electromagnetic spectrum wavelengths • Environmental Remote Sensing • Visible wavelengths 2. Near/mid Infra-Red • 3. Thermal infra-red (Heat) 4. Microwave radar (cloud-free) Reflected: Emitted:
2. Sensor types: resolution (pixel size)<1 metre to 10 kilometre Low resolution 1km -10km (national) 5000 x 5000km www.goes.noaa.gov Medium res. 100 -500 m (regional) 500 x 500km MODIS High resolution 10-100 m http://landsat.gsfc.nasa.gov/ 200km (1972->80m) (1982->30m) SPOT 60 x 60km (1986-10m) http://gallery.spotimage.com/ Very high 1 - 10 metres (Local) 60 x 60km IkonosQuickbird Tsunami 2004Geoeye
3. Types of sensors – active or passive mode Passive – capturing reflected solar or emitted terrestrial radiation Most of the images so far Active – using sensor generated energy RADAR (microwave) LiDAR (visible / near IR) Sensors: Remote Sensing Instruments Full list: http://visibleearth.nasa.gov/view_set.php?sensorName=all New satellite sensors: http://members.home.nl/wim.h.bakker
There are 3 types of image displays: a. RGB composite = 3 ‘bands’ left - visible wavelengths Right – using IR Single band b. Grayscale -> c. Pseudocolour
High-res imagery: large-scale small area http://www.abc.net.au/news/infographics/qld-floods/beforeafter.htm
Low res: large area http://www.ssmi.com/sst/sst_data_daily.html?sat=tmi_amsre
03 2003: Cranbrook Hill – the green University
06 2006 Cranbrook Hill – the red-green university
remote sensing change applications Lake loss: Aral Sea
Earthshots: satellite images of environmental change Urban expansion: Las Vegas Agricultural expansion- Elburz, Iran Environmental accident: Chernobyl Deforestation: Rondonia (Brazil) desertification - Aral Sea
TERRA satellite 1999 Includes two sensors: MODIS and ASTER MODIS- bands and applications (250 / 500 / 1000m) http://modis.gsfc.nasa.gov/about/specifications.php MODIS- sensing for global change research: http://glcf.umiacs.umd.edu/library/pdf/ieeetgrs36_p1228.pdf
MODIS Rapid Response System Global Fire Maps http://rapidfire.sci.gsfc.nasa.gov
Landsat image, Mt. Robson Park, 1990 (all Landsat archive -> online in 2009)
Successive glacier extents for Mt. Robson glaciers 1900-2005
Glacier Change in Area (km²) (~ 1985 – 2005) -285 km² -78.8 km² -824 km² - 167 km² -89.1 km² - 453 km² -235 km² - 814 km² -342 km² - 3.4 km² T. Bolch, B.Menounos, R. Wheate
Glacier Retreat Rates (% a-1) (~ 1985 – 2005) -0.44 ± 0.15 -0.79 ± 0.15 -0.35 ± 0.13 Alberta: -1.27 ± 0.17 -1.20 ± 0.16 BC: -0.54 ± 0.15 -0.88 ± 0.16 -1.21 ± 0.23 -0.67 ± 0.15 -0.61 ± 0.18 -0.72 ± 0.14 -1.11 ± 0.24 Whole Inventory: -0.55 ± 0.16 3 - Glacier Changes T. Bolch, B.Menounos, R. Wheate
Glacier Retreat Rates (% a-1) (1985 – 2000; 2000-2005) -0.69 ± 0.23 -0.27 ± 0.19 -1.03 ± 0.70 -0.44 ± 0.53 -0.47 ± 0.33 -1.21 ± 0.96 -0.66 ± 0.23 -0.49 ± 0.26 -0.92 ± 0.74 -0.79 ± 0.81 T. Bolch, B.Menounos, R. Wheate
1992 2006
3D Visualisation of past and future changecreated from air photos, images and mapping Glaciers and vegetation Glacier National Park (Montana)
MARS720: Is there global change on Mars? http://www.msss.com/mars_images/moc/CO2_Science_rel/ DEM resolution z = 30cm!
Useful websites NASA weekly images http://earthobservatory.nasa.gov/Newsroom/ Earth image of the day: http://earthobservatory.nasa.gov/IOTD/view.php Visible Earth: http://visibleearth.nasa.gov/