Download
1 / 15
160 likes | 294 Vues
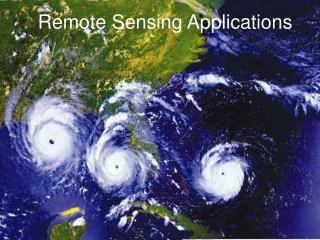
Remote Sensing Applications in Global Change Studies. What is Global Change?. Global warming: (1) growing season change plant growth change (2) increase in temp plant growth (3) increase in temp increase evaporation plant growth

E N D
What is Global Change? • Global warming: • (1) growing season change plant growth change • (2) increase in temp plant growth • (3) increase in temp increase evaporation plant growth • Increasing adverse weather conditions: • (1) drought • (2) hurricanes • Land-cover/land-use change • (1) urbanization • (2) deforestation • (3) agricultural expansion • (4) loss of wetland • 4. Increasing invasive species • 5. Increasing population demand of resources • …
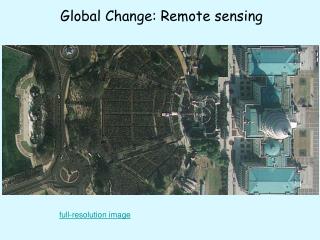
Monitoring Global land-cover/land-use changes Landsat provides the longest time series of archived land surface conditions: 1972-1984: Landsat MSS at 78x78 m spatial resolution 1984-2008: Landsat 4, 5 and 7 at 30x30 meter spatial resolution Landsat 5 TM image on Dec 30, 1995 at Shenzhen special econ. zone, China (RGB=432) Landsat 5 TM image on Dec 10, 1988 at Shenzhen special econ. zone, China (RGB=432)
AVHRR Global NDVI time series data: 1x1 km with daily coverage Tucker et al., 1985, 227: 369-375.
MODIS LST Product Global browse image at 5km resolution of the daytime 1km LST product from first B-side MODIS data A2000306 (11/01/2000) 250K 340K Courtesy of MODAPS, MODLAND, and LDOPE 1km daily L2/L3 LSTs since late July 2000 1km 8-day L3 LST since late August, 2000 Z. Wan -2- MODLAND/Wan
MODIS Global Fire Browse November 29, 2000 Available at 20km and 5km at http://modland.nascom.nasa.gov/browse/ MODLAND/Justice et al
Remote Sensing of Aerosols Aerosols, the floating particles in the air can absorb radiation cooling the surface and warming the atmosphere, impact hydrological cycle through changes in cloud cover, cloud properties and precipittion. Kaufman et al., 2002. Nature, 419: 215-223.
Fine Aerosol optical thickness from MODIS (Sept 2000) Fine aerosols in Europe and north American: a & c Pollution: e Fire: b & d Kaufman et al., 2002. Nature, 419: 215-223.
Global Composite Map of Nadir BRDF-Adjusted Reflectance (NBAR) Sept. 29 - Oct. 30, 2000 no data Red (0-0.20)Green(0-0.20)Blue(0-0.20), 10 km resolution, Hammer-Aitoff projection, produced by MODIS BRDF/Albedo Team MODLAND/Strahler et al.
0.0 0.1 0.2 0.3 0.4 0.5 Global Broadband White-Sky Albedo (0.3-5.0µm) Sept. 29 - Oct. 30, 2000 no data 10 km resolution, Hammer-Aitoff projection, produced by MODIS BRDF/Albedo Team MODLAND/Strahler et al.
Tree cover 0% 100% 500 km Percent tree cover map of the U. S. from 250 meter MODIS data using maximum NDVI composite for summer 2000 acquisitions MODLAND/Townshend et al
MODIS LAI MODIS FPAR MODLAND/Myneni et al.
MODIS GPP Product MODLAND/Running et al.
Global net primary production as as seen from AVHRR imagery Nemani et al., 2003, Science, 300:1560-1563
Change in Growing Season Length Myneni et al., 1997. Nature, 386:698-702.