Download
1 / 15
150 likes | 293 Vues
ICARTT 2004 Ronald H. Brown – Measurements Relevant to Aerosol Direct Radiative Forcing. Regional Assessment of Aerosol Direct Radiative Forcing - M EASUREMENTS. Measurements: Sub-1 m m particles Cavity Ring Down Extinction Cell Aerosol extinction & f(RH) (66% / 30%) continuous

E N D
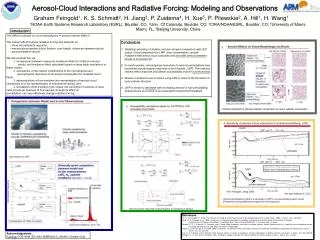
ICARTT 2004 Ronald H. Brown – Measurements Relevant to Aerosol Direct Radiative Forcing
Regional Assessment of Aerosol Direct Radiative Forcing - MEASUREMENTS
Measurements: Sub-1 mm particles • Cavity Ring Down Extinction Cell • Aerosol extinction & f(RH) (66% / 30%) continuous • plus humidity scans • Humidograph • Aerosol scattering & f(RH) • humidity scans (increasing and decreasing RH) • between 35 and 90% RH • Aerosol composition • Aerodyne Mass Spectrometer, PILS, impactors • SO4=, NO3-, NH4+, POM, EC, Trace elements
Comparison of Hygroscopic Growth Dependence of Aerosol Scattering from Humidified Nephelometer and Extinction from CRD DOY 203 (12:00 UTC) f(RH) f(RH) RH RH
Extinction (Mm-1) Comparison of Extinction Measured by Cavity Ring-down Extinction Cell and OPAL (LIDAR) at = 355 nm Ambient RH = 80 to 90%
RHB: Time Series of Sub-10 um Scattering and AOD J31 Overflights
Time series of AOD and spectral slope Regions of higher AOD: Polluted, more small particles stronger spectral dependence
Wang et al., JGR, 2003. Used shipboard AOD measurements to determine the accuracy of AOD retrievals from the GMS5 geostationary satellite.
Markowicz et al., JGR, 2003. Used shipboard f(RH) measurements to estimate the dependence of Surface and top of atmosphere forcing on RH. Diurnally averaged aerosol forcing efficiencies determine from a radiative transfer model as a function of RH.
Contacts: f(RH): Tahllee Baynard, tbaynard@al.noaa.gov Wei Wang, weiwang@uiuc.edu Scattering, backscattering, absorption: Trish Quinn, patricia.k.quinn@noaa.gov Also available at http://saga.pmel.noaa.gov/data AOD: Trish Quinn, patricia.k.quinn@noaa.gov Also available at http://saga.pmel.noaa.gov/data