Download
1 / 24
270 likes | 413 Vues
Characterization of speciated aerosol direct radiative forcing over California. Chun Zhao, L . Ruby Leung, Richard Easter Pacific Northwest National Laboratory, Richland, WA, USA Jenny Hand Colorado State University, Fort Collins, CO, USA Jeremy Avise

E N D
Characterization of speciated aerosol direct radiative forcing over California Chun Zhao, L. Ruby Leung, Richard Easter Pacific Northwest National Laboratory, Richland, WA, USA Jenny Hand Colorado State University, Fort Collins, CO, USA Jeremy Avise California Air Resources Board, CA, USA 13thWRF Users' Workshop Boulder, Colorado, June 28, 2012
Aerosol impact over California • California is one of the most polluted regions in the world, with air quality that is likely affecting well-being of people. • Air pollution control reduced aerosol concentrations, which has potential to cause an increase in solar radiation and weaken the aerosol effect of regional climate change mitigation. • Understanding the seasonal variation and speciation of aerosol and its direct radiative forcing over California is important to provide further information as guidance for future emission control strategies.
WRF-Chem • MADE/SORGAM aerosol scheme (Modal) coupled with GOCART dust emission scheme [Ginoux et al., 2001, Zhao et al., 2010]. • Aerosol SW and LW direct radiative effects coupled with RRTMG radiation schemes [Zhao et al., 2011]. • Morrison microphysics scheme and Grell convective scheme • 12km horizontal resolution; simulation for 2005; driven by NARR reanalysis • ARCTAS-CARB anthropogenic emission inventory for June 2008; GFEDv3 biomass burning emission inventory for 2005
Aerosols in the model are assumed internally mixed. • A methodology is developed to diagnose the optical depth and direct radiative forcing of individual aerosol species: AOD[species i] = AOD[all-species] – AOD[without species i] Forcing[species i] = Forcing[all-species] – Forcing[without species i] • Optical properties and direct radiative forcing for OM, EC, dust, sulfate, and a single group lumping all other aerosol species are estimated.
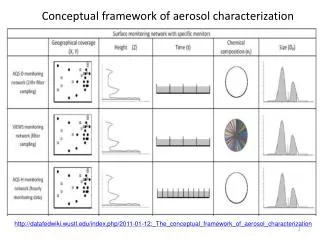
Spatial correlation coefficient and mean bias: • 2m T: 0.90-0.94 with mean bias < 2 oC • 2m RH: 0.7~0.9 with mean bias < ~0.1 • Rain: 0.5-0.8 with mean bias < ~10 mm/month • Solar radiation: 0.98
EPA (urban): triangles (100) • IMPROVE (rural): circles (40) • High total PM2.5 over the Central Valley (CV) and the Los Angeles metropolitan regions (LA) • Seasonality with highest in winter and lowest in summer • Model captures the spatial distribution and seasonality; and high PM2.5 concentrations over southeastern California (due to dust)
2008 for 2005? Low emission? Resolution? High bias nearby the source region Resolution? Low emission? Resolution? SOA? Gas-aerosol partition Photochemistry High bias nearby the coastal areas Emission scheme? Measurements? Improve speciation profiles Doubled EC
ECx2 simulation • High AOD and AAOD over the CV, LA, and the deserts • Higher AOD/AAOD over the CV and the LA than over the deserts • More distinct seasonality of AOD/AAOD over the CV and the LA than over the deserts
Differences between the diagnosed and simulated AOD and AAOD: non-linear interactions among the internal-mixed aerosol species • AOD: winter maximum and fall minimum, determined by that of anthropogenic aerosols. Sulfate AOD is largest. The AOD for EC and OM is small, but may have low biases. • AAOD: summer maximum and winter minimum, determined by EC and dust. Aerosol species other than EC and dust also enhance the absorption and account for 15-20% of AAOD.
Non-linear interactions • TOA: most aerosols-negative radiative forcing, except EC • Atmosphere: EC and dust are biggest contributors (~90%) to warming; Internal mixing enhances warming. • Surface: all aerosols have a cooling effect. EC is the largest contributor in summer, while sulfate is in winter.
Summary • WRF-Chem captures the observed seasonal meteorological conditions over California. • WRF-Chem reproduces the observed spatial and seasonal distribution of most aerosol species, except underestimating the surface concentrations of OM and EC, potentially due to uncertainties or/and interannual variabilities of the anthropogenic emissions of OM and EC and the outdated SOA mechanism. A sensitivity simulation with anthropogenic EC emission doubled significantly reduces the model low bias of EC. • The seasonality of aerosol surface concentration is mainly determined by vertical turbulent mixing, ventilation, and photochemical activity, with distinct characteristics for individual aerosol species and between urban and rural areas.
Summary • Anthropogenic aerosols dominate the aerosol optical depth (AOD). The ratio of AOD to AAOD shows distinct seasonality with a winter maximum and a summer minimum. • On statewide average over California, aerosol reduces the seasonal-average surface radiation fluxes by about 3 W m-2 with a maximum of 10 W m-2 in summer. In the atmosphere, aerosol introduces a warming effect of about 2 W m-2 with a maximum of 10 W m-2 also in summer, with EC and dust as the main contributors (about 90%). At the TOA, the overall aerosol direct radiative effect is cooling with a maximum of -3.5 W m-2. EC contributes exclusively to the TOA warming of up to about 0.7 W m-2.
Impact of BC emission control (1980’s~2000’s) Solar Radiation at Surface Clear Sky All Sky
Impact of BC emission control (1980’s~2000’s) Surface Temperature Atmospheric Heating