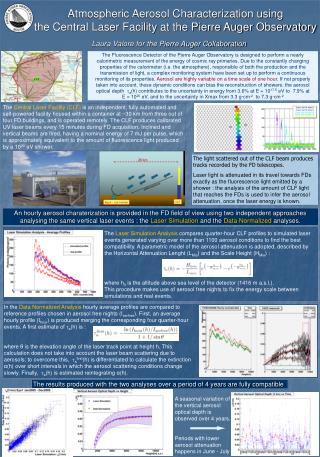
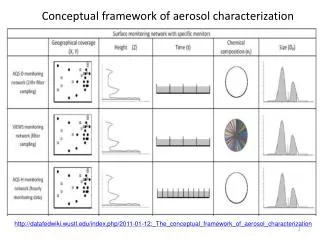
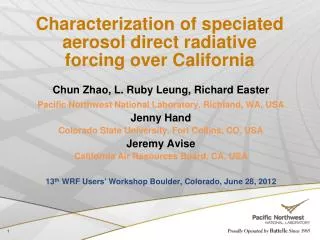
Download
1 / 9
90 likes | 184 Vues
Vertical Characterization of Aerosol over the U.S. - Aeronet , MODIS AOT. Erin Robinson, Alan Pinkert June, 2010. Activities. Begin comparing MODIS to Aeronet standard AOT Comparing trends in Aeronet station patterns along similar latitudes. Varied Cursor Box Size and Statistic (GSFC).

E N D
Vertical Characterization of Aerosol over the U.S. - Aeronet, MODIS AOT Erin Robinson, Alan Pinkert June, 2010
Activities • Begin comparing MODIS to Aeronet standard AOT • Comparing trends in Aeronet station patterns along similar latitudes
Varied Cursor Box Size and Statistic (GSFC) .1 Deg x .1 deg .5 Deg x .5 deg 1 Deg x 1 deg • Chose to vary the cursor box from .1 deg x .1 deg (resolution of MODIS) to 2 deg x 2deg • Varied statistical aggregation for 5th percentile, 60th percentile and 95th percentile.
Seasonal Comparison – Annual R2 (Blue low; Red ~1) Slope (yellow =1; Red > 1) Compared the R2 value for how ‘repeatable’ the measurement was The slope of the scatter plot indicates how close the Modis measurement is to Aeronet standard overall Good correlation on East and NW MODIS approxmates most sites well (yellow paddles (slope = .8-1); Overestimates in west
Seasonal Comparison – Winter R2 (Blue low; Red ~1) Slope (yellow =1; Red > 1) Low correlation at all sites MODIS approxmates most sites well (yellow paddles (slope = .8-1); Overestimates in west
Seasonal Comparison – Summer R2 (Blue low; Red ~1) Slope (yellow =1; Red > 1) Good correlation on East and NW MODIS approxmates most sites well; Overestimates in west The Walker Branch site shows good correlation, but slope is underestimated – this could be a systematic error that could be fixed
Troposheric Aerosol • Aerosol in the troposphere at a constant latitude has the same composition • Looking at Aeronet cycle views over for sites in a similar latitude to determine if there are any consistent patters • Patterns between multiple sites mean that the aerosol is likely in troposphere and not on the surface.
Southwest U.S. January to April Peak