Download
1 / 19
190 likes | 335 Vues
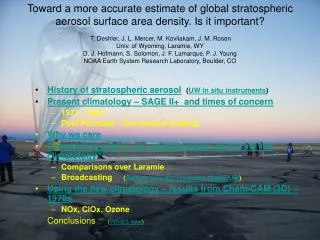
Main Topic: Vertical Characterization of Aerosols Sub-topic: Tropospheric and Stratospheric Aerosol Erin Robinson, July5, 2010. Sub-Project Topic: Tropospheric and Stratospheric Aerosol AOT. Purpose of :

E N D
Main Topic: Vertical Characterization of AerosolsSub-topic:Tropospheric and Stratospheric AerosolErin Robinson,July5, 2010
Sub-Project Topic:Tropospheric and Stratospheric Aerosol AOT Purpose of : • Estimate the AOT for tropospheric and stratospheric aerosol layers to enable using the column measurements to estimate surface AOT
Background:Vertical Structure of Atmospheric Aerosols LT ~ years LT ~ weeks LT ~ days
Approach: • Use multi-sensory obs, starting with Aeronet spectral AOT data • Observe seasonal pattern • Separate layers based on spectral and seasonal characteristics • Assumptions: • Each aerosol layer has different • seasonal and/or • spectral characteristics
NASA AERONET Federated Sun Photometer Network~ 40 site over N. America, ~100+ over the world Standard Instrument CIMEL - France Data Handling: Standard Data Processing Central Data Archive Retrieval: Spectral Optical Depth Columnar Size distribution Applications: Satellite Ground Truth Aerosol Properties Holben et al., 1998, 2001;
Separating Stratosphere • Assume that the stratosphere and troposphere have a constant spectral profile year-round • Assume it is constant over the entire world. • Use Mauna Loa to determine stratospheric component because it is at 4.2 km above sea level (only tropo and strato components).
Separating Stratosphere/Troposphere • Unknowns: τTrop(λ), τStrat(λ) • τTot(λ) = τTrop(λ) + τStrat(λ) • Angstrom Exponent: • τ(λ) = C*λ-α • α = -ln(τ(λ1)/τ(λ2))/ln(λ1/λ2)
Mauna Loa • Based on the assumption that W,S,F are constant and just stratosphere: • Assume AOT values for stratosphere at peak (day 120) • Subtract those values from total AOT to find Trop • Calculate the Angstrom Exponent for troposphere and stratosphere • Assume these Angstrom Exponents are constant
Mauna Loa Since we know τTot(λ) for λ=380, 500 and 675 nm we can chose two wavelengths substitute and solve for τTrop(λ), τStrat(λ) Iteration is needed to establish the correct stratosphere background
Separating Troposphere/Surface • Use island sites to avoid complication with continental sources • Started with Midway Island because it is at sea level, it is a few km2 and could be considered a ‘stationary platform’ • Assume that the surface and troposphere have a constant spectral profile year-round • Surface AOT is predominantly sea salt
Separating Troposphere/Surface • Unknowns: τTrop(λ), τSurface(λ) • τTot(λ) = τTrop(λ) + τSurface(λ) + τStrat(λ) • Angstrom Exponent: • τ(λ) = C*λ-α • α = -ln(τ(λ1)/τ(λ2))/ln(λ1/λ2)
Midway Island Spring Peak in March-May Rest of year is spectrally white
Discussion • Guessing the spectral profile of the surface and subjectively determining the ‘best fit’ • Only using two wavelengths. Would bringing in a third wavelength help?
Future work: • Based on Smirnov et al (2003) work, incorporate surface wind speed into model to determine if aerosol is sea salt on surface or elevated • Based on Prospero et. al (2001), add chemical speciation on the surface from the 1985-2000 in order to better estimate spectral profile • Incorporate relative humidity into model. Sea salt is hydroscopic, so high humidity may mean bigger particles • Look at additional stations in the Pacific. • Once we’ve separated the surface and the troposphere components we can subtract this troposphere from other continental sites in the same latitude belt • Validate the MODIS and MISR AOT with Aeronet we will be able to make this same subtraction from the satellite and characterize AOT both horizontally and vertically
Method • Pick Aeronet sites in Pacific where there isn’t a lot of pollution • Extract three wavelengths (380, 500, 675) and plot • We assume that the only components in the pacific column are sea salt at the surface and the additional is from the troposphere. • AOT Surf + AOT Trop = AOT Tot
Angstrom Exponent • The other information we have about the aerosol is the angstrom exponent • Bext = C(Lambda)^-A • A= - ln(Tau1/Tau2)/ln(wavelength 1/wavelength 2) • A is the slope between two wavelengths and indicates the color of the aerosol • For the pacific island sites we made the assumption that the surface angstrom exponent = 0 and that the troposphere would have a constant A
6 Equations/ 6 Unknowns • We have six unknowns, AOT Surf and Trop for 380, 500 and 675 • We know that AOT surf + AOT trop = AOT tot • This gives us 3 equations • Since the AngsExponent on the surf is 0 we can say that AOTsurf 380 = AOTsurf 500= AOTsurf 675 • This gives us 2 independent equations AOT380=AOT 500 and AOT380 = AOT 675
Last Equation • At the peak we assume a surface AOT and then calculate the tropospheric AOT and the trop Angstrom Exponent • We assume that Angs Exponent is fixed in the troposphere, so then we can substitute and solve for Surf AOT 380 • We then get two curves – Surf and trop • We iterate to find the best sea salt concentration