Download
1 / 42
420 likes | 518 Vues
Toward a more accurate estimate of global stratospheric aerosol surface area density. Is it important? T. Deshler, J. L. Mercer, M. Kovilakam, J. M. Rosen Univ. of Wyoming, Laramie, WY D. J. Hofmann, S. Solomon, J. F. Lamarque, P. J. Young NOAA Earth System Research Laboratory, Boulder, CO.

E N D
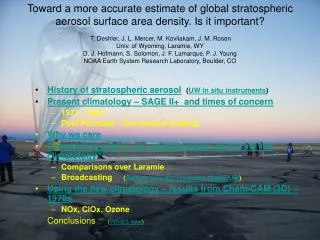
Toward a more accurate estimate of global stratospheric aerosol surface area density. Is it important? T. Deshler, J. L. Mercer, M. Kovilakam, J. M. RosenUniv. of Wyoming, Laramie, WY D. J. Hofmann, S. Solomon, J. F. Lamarque, P. J. YoungNOAA Earth System Research Laboratory, Boulder, CO • History of stratospheric aerosol(UW in situ instruments) • Present climatology – SAGE II+ and times of concern • 1971 - 1984 • Post Pinatubo – low aerosol loading • Why we care • Comparison with in situ measurements and fixing the climatology • Comparisons over Laramie • Broadcasting (Surface area discrepancies (SAGE/UW) • Using the new climatology – results from Chem-CAM (3D) – 1970s • NOx, ClOx, Ozone Conclusions (What’s new)
Summary • Present aerosol surface area density climatology has some deficiencies, < 1980, 1981-1984, > 2000 • A new climatology corrected with in situ measurements is available along with the in situ measurements used to develop it. See: http://www-das.uwyo.edu/~deshler/ • First results with the new climatology show differences in NOx, ClOx and OH leading to ± 0.5% for global average ozone in the 1970s when stratoshperic chlorine was 1500 – 2000 ppt. A total of 1% change does not sound like much, but recall globally the mid latitude ozone loss through the 1980s was on the order of 5%. • Future work • Fix blanks at pressures > 100 hPa in El Chichon period • Smooth climatology at pressures < 20 hPa, where signal is very weak • Use the new climatology in model runs, 1980-1985, and 1991-2010 • There are many people and agencies to thank for these results • Funding over the last 40 years – NSF, NSF, NSF, NASA, NRL, ... • The pioneers Jim Rosen and Dave Hofmann, and their (and my) engineers, technicians, scientists and students necessary to complete the measurements. • Susan Solomon for the invitation to a sabbatical and providing the means to get introduced to the world of atmospheric models, and to Jean Francois Lamarque and Paul Young for guiding me into the details
Four Lidar Records In Situ Record Two altitudes SAGE SAGE II Satellite Record Update through 2009 of Figure 1 from Deshler, T. (2008), A Review of Global Stratospheric Aerosol: Measurements, Importance, Life Cycle, and Local Stratospheric Aerosol, Atmos. Res., 90, 223-232.
Current Surface area density used in Atmospheric models Periods of concern
Why we careN2O5 + H2O(aer) 2HNO3 • Consequences of this conversion • Less N2O5 for: N2O5 +hν NO2 + NO3 • Less NO2 for: • NO2 + ClO + M ClONO2 • NO2 + OH + M HNO3 • More ClO for • HO2 + ClO HOCl +02, HOCl +hv OH + Cl • Cl +03 ClO +02 • More OH for: • OH +03 H02 +O2 • HO2 +03 OH +02 + 02 • Net result • Less ozone from reactions with ClO and OH • More ozone from reduction in loss from NOx
Revising the climatology using In Situ Aerosol Profiles University of Wyoming – with particular thanks to Jim Rosen and Dave Hofmann • http://www-das.uwyo.edu/~deshler/ • US_Laramie_41N_105W (1971 - 2009) • AU_Mildura_34S_142W (1972 - 1980) • NZ_Lauder_45S_170E (1991 - 2001) • Ant_McMurdo_78S_167E (1989 - 2008) • SE_Kiruna_68N_21E (1991 - 2004) • Miscellaneous • Brazil, Niger, France
Aerosol concentration for particles > 0.01, 0.15, 0.25 µm Oct 1971 Oct 1974 Fuego
Aerosol concentration for particles > 0.01, 0.15, 0.25, …2.0/10.0 µm Mar 1991 July 1991 Pinatubo
Fixing the climatology • Surface Area Comparisons over Laramie with SAGE II • Resultant ratios – UW : SAGE • Broadcasting • Comparison with far flung measurements • Mildura Australia (1972-1980) • Lauder New Zealand (1991-2001) • Led to determining rate of latitudinal spread and weighting functions for dispersal from eruptions
Post - Pinatubo Moderate aerosol load Particles large enough to Allow extinction Measurements represent Surface area
Low aerosol load Extinction measurements Can’t see the small particles Controlling surface area
1988 – 1991 Pre Pinatubo Aerosol load high enough for extinction meas. to obtain good estimates of surface area Peak of Pinatubo SAGE blinded Post Pinatubo low aerosol load Decay of Pinatubo aerosol in good range for extinction measurements
Periods of concern Period investigated With CAM - chem
Results CAM – chem run through 1970s NOx New / Old Climatology
Results CAM – chem run through 1970s NOx Profiles 40 N New / Old Climatology Revised Climatology Fuego
Results CAM – chem run through 1970s NOx profiles 40 S New / Old Climatology Revised Climatology Fuego
Results CAM – chem run through 1970s
Results CAM – chem run through 1970s ClO New / Old Climatology
Results CAM – chem run through 1970s ClO 40 N New / Old Climatology Revised Climatology Fuego
Results CAM – chem run through 1970s ClO 40 S New / Old Climatology Revised Climatology Fuego
Results CAM – chem run through 1970s Ozone New / Old Climatology
Ozone 40 N New / Old Climatology 40 S is similar Results CAM – chem run through 1970s Revised Climatology Fuego
Total ozone global average New / Old Climatology Results CAM – chem run through 1970s Revised Climatology Fuego
Wyoming Optical Particle Counter, r > 0.2 - 10.0 m Aerosol in Optical Chamber Processor White light PHA PMTs Pump
Low Gain Mid Gain High Gain
1971 - 1990 1990 - present Post El Chichon Initial Measurement Sizes
Sources of Error • Size • Aerosol index of refraction and shape • Uniformity of illumination • PMT response – pulse width broadening • Number concentration • Flow rate • Coincidence • Poisson counting uncertainty
Estimates of differential surface area (m2 cm-3), extinction (km-1) , and volume (m3 cm-3) for in situ measurements in 1993 and 1999 Evolution of Pinatubo Aerosol
a) b
Comparison of SAGE v6.0 and 6.1 with UWOPC extinction – 525 1020 nm