Radiative Forcing
Explore the concepts of radiative forcing, feedbacks, and climate sensitivity in the context of Earth's energy balance and temperature changes. Learn about positive and negative forcings, the role of greenhouse gases, and the impact on global climate.

Radiative Forcing
E N D
Presentation Transcript
Radiative Forcing • Definition: A change in the net radiation at the top of the atmosphere due to some external factor.
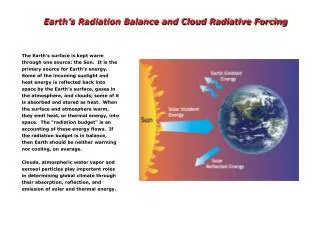
Net Radiation • Net radiation = Incoming - Outgoing • Positive net radiation • Incoming > Outgoing • Negative net radiation • Outgoing > Incoming
Positive & Negative Forcing • Positive forcing warming • Negative forcing cooling
Forcing and Feedbacks • “Forcing” is produced by an external process, e.g. • Changes in solar flux • Volcanic eruptions • Human actions • A feedback is a response to temperature changes • Example: Increased water vapor due to warming • Anthropogenic increases in greenhouse gases are considered forcings • Increases in greenhouse gases that are caused by temperature changes are feedbacks
The same gas can be involved in forcings and feedbacks, e.g., CO2 • Forcing: • CO2 increase from burning of fossil fuels • Largest – by far: increased greenhouse gases • Increase is almost entirely anthropogenic • Feedback • temp decay CO2
Initial Equilibrium Top of atmosphere OLR Absorbed Shortwave Now, add greenhouse gas Keep temperatures fixed
Reduced Upward Flux Top of atmosphere OLR Absorbed Shortwave
Net Downward Flux Top of atmosphere Net Flux Result: A positive radiative forcing
Negative Radiative Forcings • Largest: Increase in sulfate aerosols • Mostly anthropogenic
Effect of Anthropogenic Sulfate Aerosols on Temperature • Direct effect • The aerosols themselves reflect sunlight • This is similar to the effect of volcanic aerosols • Indirect effect • Sulfate aerosols act as condensation nuclei • This increases the droplet concentration in clouds • Result: Increased cloud albedo • Both effects tend to increase the Earth’s albedo
Solar Irradiance • Some evidence suggests solar irradiance may have increased lately • Current estimate of forcing: very small • Note: Evidence is very weak!
Climate Sensitivity • The change in equilibrium temperature per unit of radiative forcing
New Equilibrium Temp Temperature Change in equilibrium temp Temp. rises Start in equilibrium Time Apply radiative forcing
Example • Suppose Sensitivity = 2C per unit of forcing (1 Wm-2) • Radiative forcing = 3 Wm-2 • Then, eventual warming = 2 x 3 = 6C
Differing Sensitivities System 2 is twice as sensitive 2 C 1 C Same radiative forcing applied at t= 0
Comparing Models • Double CO2 content of model atmosphere • Radiative forcing ~ 4 W/m2 • IPCC has compared many climate models • Results used to estimate actual climate sensitivity of Earth
Sensitivity Estimates Model sensitivities have a range of 2C to 4.5C for a doubling of CO2 (A technical point – don’t memorize.)
The Role of Feedbacks • Model sensitivity is determined by the strength of the feedbacks in the model • Positive feedbacks increase sensitivity • Negative feedbacks decrease sensitivity
Differences in Model Sensitivity • Main Cause of Variation: Cloud Feedbacks • In most models, cloud feedback is positive • However, magnitude varies a lot from one model to another
Thermal Inertia Determines rate of temperature change
Rate of Warming • Thermal inertia: resistance of system to temp. change • Measured by heat capacity • Higher heat capacity slower warming
Temperature Change (C) System 1: 70% of warming has occurred at t = 1.2 System 2: 70% of warming has occurred at t = 2.4 Time
Earth-Atmosphere System • Most of the heat capacity is in oceans • Presence of oceans slows down warming
Comparison • Look at two systems with same radiative forcing and sensitivity, but different heat capacities
Summary • Positive (negative) radiative forcing causes warming (cooling) • System warms (cools) until equilibrium is restored • Amount of eventual warming (cooling) depends on radiative forcing and sensitivity • Eventual warming (cooling) = sensitivity x rad. forcing • Rate of warming is inversely proportional to heat capacity
More Realistic Situation • Previous examples assumed radiative forcing applied instantaneously • i.e., all GHG & aerosols added instantaneously • Real life: GHG & aerosols added gradually
21st Century Climate Change • Dominant influence likely to be increase in greenhouse gases (anthropogenic) • Projections of temperature change are made using climate models
Climate Models – 3 Anthropogenic forcing Input Climate Model Output Climate change
Calculation of Future CO2 Concentrations -- Method Model Input Anthropogenic Emissions Carbon Cycle Model Model output CO2Concentration increase
Climate Models -- 5 • Complication: Models have differing sensitivities models produce different results for same emission scenarios
Differing Response of Models for Same Scenario High Sensitivity Global Mean Temperature Low Sensitivity Time
Summary: Two Causes for Large Range in Projections • Wide range in emission scenarios • Wide range in model sensitivities #1 due to uncertainty in future human actions (i.e., it is not a fault of the models) #2 is due to our imperfect understanding of the climate system (i.e., it is a fault of the models)
Impacts • Arctic: large reduction in summer sea ice • Arctic could be ice-free in summer by end of century • Permafrost = soil that remains frozen throughout the year • Warming softening of permafrost
Impacts • Glaciers and Ice Sheets • Mountain glaciers will continue to shrink • Greenland ice sheet will very probably lose mass • Antarctica (?)
Impacts: Sea Level • Melting glacial ice and thermal expansion will cause sea level to rise • Estimated rise • Low-emission scenario: 18 – 38 cm • High-emission scenario: 26 – 59 cm • Estimates are probably too low • Contribution from ice sheets was not taken into account!
Impact of Rising Sea Level • Greatest in countries with heavily populated coastal regions, e.g. Bangladesh and in small-island nations
Fresh Water Supplies • Warming shrinking glaciers, reduced snowfall in mountains • Problem: 1/6 of world population depends on glacial & snow melt for drinking water
Precipitation • Models project increases in precipitation in some regions, decreases in others • Regions of decrease include: • Southwestern U. S., Mexico, Central America, Caribbean • Mediterranean • Regions of increase include: • Canada, most of Asia
Soil Moisture, Runoff • precip. soil moisture and runoff • But, can have soil moisture even with precip.
Effect on California • Warming less snowfall in mountains less summer runoff less water in summer for irrigation hydroelectric power drinking water • Loss of salmon habitat
More about precipitation • Models project increased variability increased flooding and increased droughts! • Another problem: increased demand for water.
Agriculture • Reductions in soil moisture reduced crop yields • However, areas with increased soil moisture could benefit • (If warming isn’t too large.)
Other Potential Agricultural Benefits of Warming • Increased growing season in higher latitudes • Could benefit Canada, Russia • Beneficial effects of increased CO2 could offset damaging effects of reduced soil moisture • Called “CO2 fertilization” • Only works if warming is relatively small
Ecosystems • In past, ecosystems have been able to adapt, but … • “ resilience of many ecosystems is likely to be exceeded by 2100” • Effects of climate change aggravated by • increased human demands • fragmentation of habitats
Ecosystems, continued • Up to 30% of species at “increasingly high risk of extinction” if average global temp increase above 2 -3C • Oceans becoming more acidic • Will hurt organisms that make shells
Carbon Cycle • Now, biosphere is a net “sink” of carbon • i.e., carbon uptake > carbon released • By mid-century, biosphere likely to become a net source of carbon • i.e., carbon release > carbon uptake • (mainly due to increased rate of decay) • Ocean carbon uptake will diminish • Result: Faster rise of CO2
Impacts on U. S. Forests • Each tree species requires a specific environment for optimum growth • Climate change will cause a shift in tree habitats • Projections of habitat changes • http://www.fs.fed.us/ne/delaware/atlas/web_atlas.html#
Tropical Cyclones – basic info • Called hurricanes in Atlantic, eastern Pacific • Called typhoons in western Pacific (north of equator) • Energy source: heat stored in oceans • Theory: warmer oceans stronger storms • (There is evidence this already happening)
Forest Fires • In western U. S., warming more forest fires
Human Health • More deaths from heatwaves • Like 1995 Chicago heat wave • Increases in some tropical diseases