Download
1 / 22
220 likes | 405 Vues
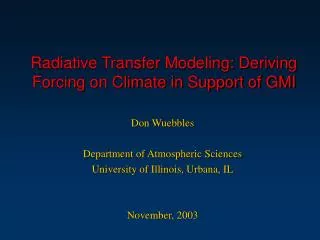
Radiative Transfer Modeling: Deriving Forcing on Climate in Support of GMI. Don Wuebbles Department of Atmospheric Sciences University of Illinois, Urbana, IL November, 2003. Effect of Gases and Particles on Climate. Determined by its radiative forcing relative to other forcings on climate.

E N D
Radiative Transfer Modeling: Deriving Forcing on Climate in Support of GMI Don Wuebbles Department of Atmospheric Sciences University of Illinois, Urbana, IL November, 2003
Effect of Gases and Particles on Climate • Determined by its radiative forcingrelative to other forcings on climate Increase in Radiative Forcing on Climate since 1750 – Driven by CO2 and other GHG
Calculation of Radiative Forcing RF (for an externally imposed perturbation) = Change in the radiative balance of the climate system IPCC Definition Globally- and annually-averaged change in net irradiance at the tropopauseafter allowing for the adjustment of stratospheric temperatures to reach radiative equilibrium but with surface & tropospheric temperature held fixed at the unperturbed values (IPCC). RFis defined without dynamical or other feedbacks on the climate system
Factors Important in DirectRadiative Forcing Calculations • Strength of longwave radiation absorption and location of absorbing wavelength • Absorption is important in “window region” (8-12 m) • Background distributions of H2O, O3, CO2, N2O, CH4 • Distribution of Clouds • Cloud fraction, location, cloud type, optical depth, cloud liquid water, effective drop radii • Distribution of concentrations of given GHGs and/or aerosols • Depends on atmospheric lifetime and emissions
UIUC Narrow Band Model • Developed for radiative forcing and energy balance climate by Atul Jain • Component in the ISAM Integrated Climate System Model • Initially developed to use seasonal and latitudinal variations in UIUC 2-D CTM • Very fine altitude structure in UTLS • 3 levels of clouds (based on ISCCP data and other observations) • netCDF inputs from 2-D model
Calculation Methodology for Radiative Forcing and Concentration • Infrared (IR) fluxes are calculated using Malkumus Random Narrow Band (NBM) radiative transfer model (Jain et al., 2000). • Includes IR opacity by CO2, CH4, N2O,O3, H2O, and Halocarbons. • Spectral Range – 0-3000 cm-1. • Spectral Width – 5 cm-1 (CO2, CH4, N2O, O3), and 10 cm -1 (H2O and other gases). • Radiance calculated over 24 Gaussian angles using 12 point Gaussian quadrature. • Short-Wave fluxesare calculated using the Delta Eddington model (Briegleb, 1992) with 18 spectral intervals (0.2 to 5 micron).
NBM-Derived Infrared Fluxes for the Top-of-Atmosphere Note that the NCEP Reanalysis compares very closely with ERBE data Jain et al. (2000)
Greenhouse Gases Studied (Jain et al., 2000) • CO2, CH4, N2O • Chloroflurocarbons (CFCs) and other Halocarbons • CFC-11, -12, -13, -113, -114, -115 • CCl4, CH3CCl3 • HCFC-22, -123, -124, -141, -142b, -225ca, -225cb • HFC-23, -32, -125, -134, -134a, -143, -143a, -152a, -161, -227ea, -236fa, -245ca • H-1201, -1311, CF2ClBr, CF3Br, CH3Br, CH2Br2, CHF2Br • CF3I, CF3CF2I • Perfluorocompounds (PFCs) • SF6, CF4
Sensitivity Studies in Jain et al. (2000) • NBM vs. BBM Radiative Forcings • Clear Sky vs. Cloudy Sky Radiative Forcings • Constant Vertical Profile-Based vs. Realistic Vertical Profile-Based Radiative Forcings • Global Average-based vs. Latitudinal and Seasonal Average-based Radiative Forcings
Estimated Seasonal and Latitudinal Dependent Changes in Radiative Forcing (Wm-2) for the Period 1750-1992 for CO2, CH4, N2O, and Halocarbons Jain et al. (JGR 2000)
Direct SO2 Aerosols GHGs Direct SO2 Aerosols +GHGs ISAM-Estimated Forcing & Climate Changesfrom Pre-Industrial Times to Present (1765-2000)
Recent Analysis of HFC-134a for IPCCOctober 2003 Radiative Forcing: Clear sky constant profile UIUC (constant diffusivity) 0.193 Wm-2 UIUC (variable diffusivity) 0.202 Wm-2 Reading Univ. 0.205 Wm-2 Oslo Univ. 0.200 Wm-2 NOAA 0.212 Wm-2
IPCC AR4 2. Changes in Atmospheric Constituents and in Radiative Forcing · Introduction · Definition and Utility of Radiative Forcing · Recent Changes in Greenhouse Gases · Aerosols – Direct and Indirect Radiative Forcing · Radiative Forcing due to Land Use Changes · Contrails and Aircraft-Induced Cirrus · Variability in Solar and Volcanic Radiative Forcing · Synthesis of Radiative Forcing Factors · GWPs and Other Metrics for Comparing Different Emissions
Using the UIUC NBM for GMI Studies • Convert NBM to use netCDF files from GMI • Transfer to use MOZART-3 files is currently in process • Will use cloudiness, grid structure, etc. from GMI • Will use atmospheric composition fields from GMI (gases, aerosols) • Testing NBM • E.g., with additional particle types • For perturbations to ozone, water vapor (e.g., Ponater et al., 2002) • Tests and studies with GMI inputs • Radiative forcing calculations for (interim and) 2006 aircraft assessment • Radiative forcing calculations for IPCC
Climate Sensitivity Traditional definition Ts = RF • = climate sensitivity parameter • varies from ~0.4-1.2 with different GCMs • reasonably constant within a given model for homogeneously distributed perturbations • Recent studies: varies for spatially inhomogeneous changes in gases (e.g., ozone) or aerosols • Larger for higher latitude changes • Larger for lower stratospheric O3 than upper tropospheric O3 • Indirect effects of aerosols require special calculations • Change in cloud albedo (due to change in droplet concentration) • Change in cloud-amount and liquid water content (associated with changes in precipitation efficiency)
Propose an “alternative” definition, particularly for comparing GCMs, called “adjusted tropospheric and stratospheric forcing” • RFatsuses fixed surface temperature (land, ocean) • Allows changes in lapse rate, clouds, water vapor • Includes many of the climate feedbacks • Run GCM to steady-state (a few years with fixed SST) Resulting is nearly constant for for all forcings
Modified Plan • Radiative forcing • Continues to be a useful concept • Much more efficient than GCM • Comparisons easier; not subject to differences in GCMs • Easier to isolate error and uncertainties in radiative aspects • At same time, we will evaluate the new concepts for RFats • Which GCM?
Temperature, Cloud Fractions, H2O, and O3 Used in Radiative Calculations for September-OctoberPre-industrial and Contemporary Time Periods Jain et al. (2000)
Comparison of Latitudinal and Seasonal Average ISAM vs.WMO Radiative Forcing Calculations