Download
1 / 32
320 likes | 566 Vues
Climate change related to floods, droughts, and water supply shortages in the Capital Area. Raymond Slade, Jr. Certified Professional Hydrologist. Slide show organization. Introduction Floods in the Capital Area Current and previous droughts Current and future water supply

E N D
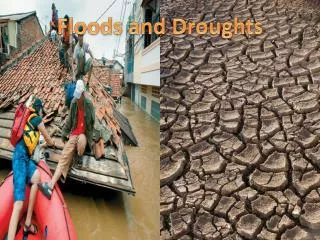
Climate change related to floods, droughts, and water supply shortages in the Capital Area Raymond Slade, Jr. Certified Professional Hydrologist
Slide show organization • Introduction • Floods in the Capital Area • Current and previous droughts • Current and future water supply shortages during severe drought
Introduction “The scientific literature and the Intergovernmental Panel on Climate Change (IPCC) have independently suggested that the intensity and frequency of extreme weather events will increase due to climate change.” American Meteorological Society It is likely that the Capital Area will experience higher and more frequent floods, and droughts with greater intensity and duration. Arguably, Central Texas, has the greatest variability in precipitation and runoff (extreme floods and severe droughts).
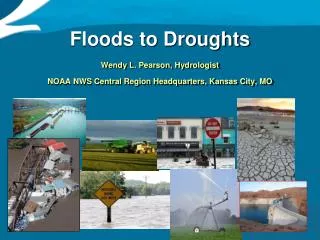
Floods in the Capital Area Google “Texas flood”…
You might get Stevie Ray Vaughn playing the song “Texas flood”
Texas leads the Nation in flood fatalities and flood damage costs Flood fatalities by State 1959-2005 Flood insurance damage costs by State 1978-2001
http://floodsafety.com/media/ffa/movieplayer.htm/trailer.htm
Hallettsville, Fayette County22.7 inches of rain, June 29-30, 1940 Also in Fayette County: 14.9 inches of rain May 22-28, 1936 13.2 inches of rain Oct. 30-31, 1981
San Marcos, Hays County30 inches of rain, Oct 17-18, 1998 Also in Hays county: 15 inches of rain May 24-31, 1929 18 inches of rain May 14-15, 1970 16 inches of rain in 4 hours and 12 inches in one hour May 11-12, 1972
Pedernales River near Johnson City, Blanco County26 inches of rain on Sept 9-11, 1952 Hwy 281
Sept 9-10, 1921 storm and flood 38.2 in. during 24 hrs at a U.S. Weather Bureau station at Thrall, Tx (national record) 215 drownings statewide--deadliest flood in Texas history. 87 people drowned in and near Taylor and 93 in Williamson County.
Colorado River at Austin, 1935 Floods in 1936 and 1938 also topped Congress Avenue bridge “Floods are merely a hazard… mankind is the disaster” Gilbert White
Austin, Texas, 1981 Memorial Day flood13 people drowned, $36 million damages 8 inches rainfall in 2 hours—largest rain depths fell outside Austin. At the time of this flood, at least 7,000 families were known to live within 100-year flood plains in Austin—most did not know. Flooded area in blue Shoal Creek near 12th Street Press release after flood Flooded area superimposed on aerial photo of part of Shoal Creek basin
Current and previous droughts Google “drought”…
You might get a TV meteorologist defining drought as an annual rainfall deficit Father Guido Sarducci Vatican Weatherman, SNL
Palmer Drought Severity Index Edwards Plateau Green—wetter than normal Through Sept. 2013 Gold – drier than normal Increasing numbers represent greater drought intensity
Historical drought severity documentation Severe droughts
Public water supply systems under water use restrictions In 10-county Capital Area (Sept 11, 2013) 145 systems under restrictions These systems serve 1,684,000 people
Reality—how we deal with drought Start here
Drought Impacts Economic Development Agricultural Production Electric Power Generation Increased Wildfire Threat Ecological Integrity Public Water Supply From Maidment
Current and future water supply shortages during severe drought
Texas Water Plan 2012 Texas Water Development Board Purpose of Plan Estimate current and future water needs (shortages) and identify water management strategies and associated costs to meet future needs. Based on • Data and analyses of current and future population, water use, and water availability (every 10 years from 2010 to 2060) • Severe drought conditions (water demand at maximum and supply at minimum) • 6 water use types: i.e., municipal (urban & rural), irrigation, livestock, manufacturing, mining, and steam electric) http://www.twdb.state.tx.us/wrpi/swp/swp.asp
Definitions of water category terms in the Texas Water Plan Existing water supplies - the amount of water that can be produced with current permits, current contracts, and existing infrastructure during severe drought.Water Demand Projections- Quantity of water projected to meet the overall necessities of an area in a specific future year. Water supply needs (shortage)- projected water demands in excess of existing supplies that would be legally and physically available during a severe record.Water management strategies- projects and associated amount of water designed to meet needs for additional water supplies during drought.
Capital Area population projections 2010 1,830,000 2020 2,322,000 2030 2,799,000 2040 3,303,000 2050 3,809,000 2060 4,277,000 Year Population 2012 Texas Water Plan Texas Water Development Board
Capital Area municipal water demand, supply, and needs Demand minus Supply = Need Need Water volume per year (acre feet) Demand Supply Need (shortage) Storage of Lake Austin
Municipal (urban and rural) water needs, 2020 Explanation Need - acre feet per year Percent that demand exceeds supply Number of water suppliers with needs Burnet 985 27% 3 Llano Williamson 1681 80% 3 16,795 52% 4 Lee Blanco Travis 48 11% 1 Total need is 1.8 times the storage in Lake Austin 11,053 181% 12 Bastrop 0 0% 0 Hays 604 36% 1 5436 52% 12 Fayette 0 0% 0 Caldwell Total for area: Need 37,011 ac-ft per year Demand exceeds supply by 65% 43 water suppliers with needs 409 57% 7
Municipal (urban and rural) water needs, 2060 Explanation Need - acre feet per year Percent that demand exceeds supply Number of water suppliers with needs Burnet Llano 7279 83% 7 Williamson 2744 57% 4 76,638 209% 5 Lee Blanco Travis 179 40% 1 Total need is 10 times the storage in Lake Austin 69,352 25% 18 Bastrop 64 37% 1 Hays 13,039 128% 2 35,513 118% 19 Fayette 0 0% 0 Caldwell Total for area: Need 223,433 ac-ft per year Demand exceeds supply by 65% 66 water suppliers with needs 2345 128% 9
Conclusion “The scientific literature and the Intergovernmental Panel on Climate Change (IPCC) have independently suggested that the intensity and frequency of extreme weather events will increase due to climate change.” American Meteorological Society Arguably, Texas, especially central Texas, already has the greatest variability in precipitation and runoff (extreme floods and severe droughts). Therefore, climate change may increase the frequency and severity of catastrophic floods, and the intensity and duration of severe droughts.