Download
1 / 46
460 likes | 669 Vues
By Nimrod Bar-Yaakov nimrod-b@orbotech.com With co-operation of Dr. Zehava Grossman of the Israel ’s Multi-Center AIDS Study Group , National HIV reference Laboratory in Tel-Hashomer. Mapping Mutations Patterns in the HIV DNA. Today ’ s Topics . HIV – Introduction.

E N D
By Nimrod Bar-Yaakov nimrod-b@orbotech.com With co-operation of Dr. Zehava Grossman of the Israel’s Multi-Center AIDS Study Group, National HIV reference Laboratory in Tel-Hashomer. Mapping Mutations Patterns in the HIV DNA
Today’s Topics • HIV – Introduction. • What so important about the HIV DNA mutations? • Early stages – Exploring RNA mutations • From RNA to Amino Acid Mutations • Recent studies and current work. • Results and future research.
Virus Overview Viruses may be defined as acellular organisms whose genomes consist of nucleic acid, and which obligately replicate inside host cells using host metabolic machinery and ribosomes to form a pool of components which assemble into particles called VIRIONS, which serve to protect the genome and to transfer it to other cells.
What is an HIV • human immunodeficiency virus, A type of retrovirus that is responsible for the fatal illness Acquired Immunodeficiency Syndrome (AIDS) • Retrovirus – A virus that's carry their genetic material in the form of RNA rather than DNA and have the enzyme reverse transcriptase that can transcribe it into DNA. • In most animals and plants, DNA is usually made into RNA, hence "retro" is used to indicate the opposite direction
How does the HIV infects the body cells? • HIV begins its infection of a susceptible host cell by binding to the CD4 receptor on the host cell • The genetic material of the virus, which is RNA, is released and undergoes reverse transcription into DNA, which enters the host cell nucleus where it can be integrated into the genetic material of the cell. • Activation of the host cells results in the transcription of viral DNA into messenger RNA (mRNA), which is then translated into viral proteins. • The viral RNA and viral proteins assemble at the cell membrane into a new virus. • The virus then buds forth from the cell and is released to infect another cell.
Treatment related to the active RNA sites • The HIV DNA generates proteins that are essential to the virus life-cycle. Medical treatment interfere or block the operation of these proteins. • Reverse Transcriptase medicines: Inhibits the transcription of the HIV RNA into the cell’s DNA • The HIV protease protein, is required to process other HIV proteins into their functional forms. Protease inhibitors medicines, act by blocking this critical maturation step.
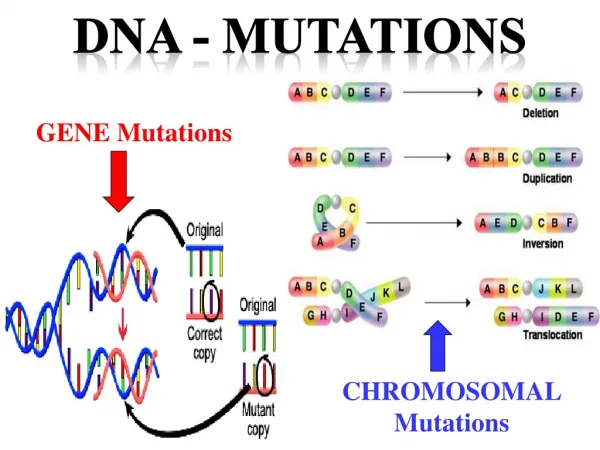
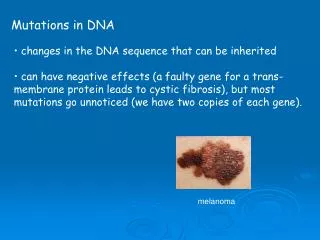
RNA mutations • Environmental/Biological processes may cause mutations in the HIV RNA. • The mutated HIV RNA merge into the infected cell’s DNA. • The generated Amino-Acids sequence is then altered. • A different Protein is generated by the cell. • The altered protein may resist the medical treatment!
Mutation families • The HIV RNA has a high mutation rate(a 1000 times more than a regular cell). • Fast evolutionary processes causes the best mutated viruses to increase their population in the infected body. • We’ll focus on 3 main mutation families: • Resistance mutations • Clade mutations • Other – noise/random
The importance of identifying the resistance mutations • Selecting the best medicine treatments • Understanding the way different medicines interacts with the HIV • Understanding the functional interpretation of the RNA sequence
Data Processing • DNA Sequence Extraction • DNA Sequence Alignment • Identifying and Filtering mutations • Creating consensus sequence and mutation matrix. • Find correlations between treatment and mutation patterns.
Extracting the RNA Sequence • The RNA sequences are transcript into DNA sequences. • The DNA sequences then multiplied several times • A DNA sequencer ‘read’ the aligned DNA sequences. • The decision how to interpret a specific DNA segment is based over image processing algorithms (define the segment boundaries and find the best match for the segment pattern) and isn’t deterministic!
Sequence Alignment • Before alignment AtaaagakagggggacagctaaaagaggctctcTTAGACACAGGAGCAGATGATACA ACTCTTTGGCAGCGaCCCCGTTGTCACaATAAAAATagGGGGACAGCTAAgGGagGc TAAAAGAGGCTCTCTTAGCACACAGGMGCAGAYGAYACAGTMCTTASCAAGAAATAA ACTCTTTGGCAGCGACCCCTTGTcACAATAAAAGTAGAGGGACAGCTAAGGGAKGCT ACTCTTTGGCAGCGaCCCCTTGTCACAATAAAAATAGGGGACAGCTAAGGGAGGCTC ACTCTTTGGcAGCGACCCCTtGTCACAATAAAAGtAGGGGGaCAGCTAAAgGAGGCT aCTnTTnGRCAGCGaCCCCTTgTCYCARtAAAAATAGGGGGGCAGRTAARGGAGGCt • After Alignment ------------------------------ATAAAGAKAGGGGG-ACAG-CTAAAAGAGG ------------C-GACCCC--TTGTCACAATAARAATAGGGGG-ACAG-CTAAAAGAGG ACTCTTTGGCAAC-GACCCC--TTGTCACAATAAGAGTAGGGGG-ACAG-CTAAAAGAGG -CTCTTTGGCAAC-GA-CCCC-TTGTCACAGTAAAAATAGRAGG-ACAG-CTAAAAGAAG ACTCTTTGGCAAC-GA-CCCC-TTGTCACAGTAAAAATAGGAGG-ACAG-CTAAAAGAAG ACTCTTTGGCAAC-GA-CCCC-TTGTCACAGTAAAAATAGGAGG-ACAG-CTMAAAGAAG ACTCTTTGGCAAC-GA-CCCC-TTGTCACAGTAAGAATAGGAGG-ACAG-CTAAAAGAAG • Degapping ---------------------------ATAAAGAKAGGGGGACAGCTAAAAGAGGC ------------CGACCCCTTGTCACAATAARAATAGGGGGACAGCTAAAAGAGGC ACTCTTTGGCAACGACCCCTTGTCACAATAAGAGTAGGGGGACAGCTAAAAGAGGC -CTCTTTGGCAACGACCCCTTGTCACAGTAAAAATAGRAGGACAGCTAAAAGAAGC ACTCTTTGGCAACGACCCCTTGTCACAGTAAAAATAGGAGGACAGCTAAAAGAAGC ACTCTTTGGCAACGACCCCTTGTCACAGTAAAAATAGGAGGACAGCTMAAAGAAGC ACTCTTTGGCAACGACCCCTTGTCACAGTAAGAATAGGAGGACAGCTAAAAGAAGC ACTCTTTGGCAACGACCCCTTGTCACAGTAAGAATAGGAGGACAGCTAAAAGAAGC
Finding mutations and treatment correlation • We want to find for each RNA index i whether P(Mut_in_i) is significantly different from P(Mut_in_ i/ Treatment). • We’ll use the CHI square distribution test for each index to find that.
Chi Square Overview • We will use the Chi-Square test to check the probability that our observed results had came from the same statistical population as the expected (chance) results. • A probability of less than 0.05 means that the results are significant, I.e the populations are significally different .
Chi Square Calculations • Calculating the chi-square statistic – • The probability Q that a X2 value calculated for an experiment with d degrees of freedom (where d=k-1) is due to chance is:
DNA processing problems • Curse of dimensionality • Noisy data • Sequenced data are of stochastic nature • Small number of samples • Clades and sub-clades • Vague definitions of independent variables values. • Silent mutations • Talk Bio language!
Results – Mutation D30N • D30N is an important resistance mutation. But it appears at frequency of 0.0258 in the C clade compare with 0.0945 in the B clade, What’s the explanation for this? • Correlation analysis reveals that in clade B, D30N is highly correlated with other resistance Mutations. In clade C it’s not. • One assumption can be that the Clade B structure can influence the connections between resistance mutations.
Moving from DNA to Amino Acid mutations • Because DNA is translated to AA that forms the protein, protein functional studies only focus on the AA aspects of the DNA. • Because 3 DNA nucleotides conforms to 1 AA – we reduce our dimensionality 3 times (though each dimension contains 22 AA). • Several sequences conforms to the same AA – reduce variability and noise. • HIV mutation research focus mainly on AA, therefore provides more comparison data.
Second nucleotide Moving from DNA to Amino Acid mutations • Translating DNA sequence to AA sequence is straight forward: ATAAAGAKAGGGGGACAGCTAAAAGAGGC ATAARAATAGGGGGACAGCTAAAAGAGGC ATAAGAGTAGGGGGACAGCTAAAAGAGGC GTAAAAATAGRAGGACAGCTAAAAGAAGC GTAAAAATAGGAGGACAGCTAAAAGAAGC GTAAAAATAGGAGGACAGCTMAAAGAAGC GTAAGAATAGGAGGACAGCTAAAAGAAGC GTAAGAATAGGAGGACAGCTAAAAGAAGC KWKPKIIGGIGGFVKVRQYDEVVVEICGK KWKPKMIG?IGGFIKVRQYDQILIEICGK KWKPKMIGGIG?FI?VRQYEEILIEICGK ?WKPKMIGGIGGFIKVRQYDQV?IEIC?K KWKPKMIGGIGGF?KVRQYDQIPIEICGK RWKPKMIGGIGGFIKVRQY?QI?IEICGK KWKPKMIGGIGGFIKVRQYDQILIEICGK KWKPKMIGGIGGF?KVRQYDQILIEICGK KWKPKIIGGIGGLIKV?QYDNISIEICGK
Moving from DNA to Amino Acid mutations • A consensus AA sequence is then calculated, noisy data is filtered, and ambiguous AA are converted to the consensus values. • Though a Mutation can receive 20 mutated values, through filtering and comparison to literature, a max of 4 mutation per AA index is set. • Mutation frequency matrix is then calculated- where every mutation, even in the same index – add a frequency column to the mutation matrix. Mutations 0A000 V000L 0P00L VA000 000G0 0P000 010000 100001 001001 110000 000010 001000 Samples
Why searching for patterns? • 1 Dimensional AA sequence folds into a 3D protein structure. • The protein active sites located along its folds, usually contains more than one AA. • Protein mutated behavior occurs along its active sites • The AA 3D proximity is different than their sequence proximity.
Active sites patternfrom - http://www.rcsb.org/pdb/index.html AA Sequence Protease Protein 3D Structure …ADDTVLEEINLPEKWTPKMIGGIGGFVKVRQYDQIPIEICGKKVIGAVLVGPTPANVIGRNL… …ADDTMLEEINLPEKWTPKMIGGIGGFVKVRQMDQIPICICGKKVIGAVLVGPTPANVIGRNL… Sequence mutation pattern Active site changing
Problem definition • Find a correlation between specific pattern all over the samples and a specific treatment Mutations NFV Treated Chi Calculation 01110100 10000100 00100101 11100000 00000000 00100110 00010000 00100100 1 0 1 0 0 0 0 1 Samples
Recent Biological studies • A thorough research and data gathering is done in Stanford university –The HIV drug resistance database • Each sample can contribute only one vote to a pattern’s count, though many sub-patterns can be located in one sample.
Recent research –Bayesian networks • K Deforcheet al. has studied the dependencies relationships of treatment type combined with AA mutations using Bayesian networks.
Recent research –Bayesian networks • Though it seems a promising way of finding relationships between a mutation and the treatment – Bayesian Network looks for connection between one variable and another, where in our case we may want to look at the relationship between a group of variables and another. • Interpreting the Bayesian Network is also a hard task, and it may only give us directions or clues toward regions where we must research again the data in order to prove statistical significance between the variables.
Data Challenges • Because each samples can contain “interesting” and “non-interesting” mutations, or mutations from different patterns – we must treat every mutation pattern in the sample as candidate. • We then sum the number of appearances of each pattern candidate in order to calculate the CHI statistics. Samples total patterns 00100100110 1 00100000011 1 10100101110 2 00010010000 2 00100100110 3 00110100100 4 00000100100 4 00110100110 5 10100100000 5
Data Challenges • The complexity of naïve traversing through all the patterns is O((N^2)*(2^K)) , where K is largest number of mutations in a single sample. And N is the number of samples. • In our data – K can reach 30 and N is ~1000, so naïve search is not feasible. • Since p(a,b/T) is hard to predict from p(a/T) and p(b/T), gradient decent methods of traversing through the mutation pattern space (where in every step we add a mutation to the pattern), may be fruitless. • There is also no apparent trait of the statistic function we want to maximize, that may ease our search.
Branch and BoundLittle et. al (1963) • An algorithmic technique to find the optimal solution by keeping the best solution found so far. If a partial solution cannot improve on the best, it is abandoned • When we can determine that a given node in the solution space does not lead to the optimal solution-either because the given solution and all its successors are infeasible or because we have already found a solution that is guaranteed to be better than any successor of the given solution. In such cases, the given node and its successors need not be considered. • In effect, we can prune the solution tree, thereby reducing the number of solutions to be considered.
Mutation 90M 30D 82I 54A 0 1 0 1 0 1 0 1 0 1 0 1 0 1 111… 110… 101… 100… 011… 010… 001… 000… Pattern Branch and Bound
Branch and Bound • Save pattern results in order to save calculation • Lower Bounds • If |(a&b)| < 3 • If p(A) > 0.5 and p(B) > 0.5 no need to check (A&B) – empirically studied, probably has biological reasoning. • Upper Bound • Statistically significance
Branch and Bound –results • Discover all single major mutations that appears in data. • Discover three major pattern groups – two of them known, one is new – need to find if there is any biological meaning.
Branch and Bound –Results • Pro’s • Exhaustive – good patterns cannot “escape” • Simple to understand and implement • Con’s • Probability lower bound isn’t well defined • Can take too long in DNA pattern calculations
BiclusteringCheng and. Church , 2000 • A clustering process of simultaneously mining column and row (say row for observation/gene and column for dimension/sample). • A bi-cluster is a subset of rows that exhibit similar behavior across a subset of columns, and vice versa. • Each node can relate to several bi-clusters at a time. • Originally developed for mining gene expression data.
Biclustering – SAMBAA. Tanay, R. Sharan, and R. Shamir, 2002 • Statistical-Algorithmic Method for Bicluster Analysis • Create a bi-partite graph from the data, where the left side is the genes and the right is the conditions. • Connect edges between the vertices on the two sides according to their “similarity”– expression level, and weight it accordingly.
Biclustering – SAMBAA. Tanay, R. Sharan, and R. Shamir, 2002 • Tanay et al. has shown how to assign weights to the vertex pairs so that a maximum weight bicluster corresponds to a maximum likelihood bicluster. • Therefore we can reduce the problem to finding heaviest sub graph in a bi-partite graph – a known combinatorial problem.
Adapting SAMBA • For each treatment – • Samples on one side, mutations on the other. • Add edge, if the sample contains the mutation • Modify weighting scheme so it can relate to the CHI square statistic
The End! • Thank you for listening. • Any Questions?