Mapping Mutations in HIV RNA
390 likes | 417 Vues
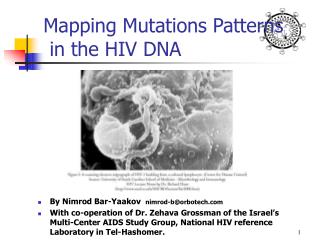
By Nimrod Bar-Yaakov nimrod-b@orbotech.com With co-operation of Dr. Zehava Grossman of the Israel ’s Multi-Center AIDS Study Group , National HIV reference Laboratory in Tel-Hashomer. Mapping Mutations in HIV RNA. Today ’ s Topics. HIV – What is it and how it operates.

Mapping Mutations in HIV RNA
E N D
Presentation Transcript
By Nimrod Bar-Yaakov nimrod-b@orbotech.com With co-operation of Dr. Zehava Grossman of the Israel’s Multi-Center AIDS Study Group, National HIV reference Laboratory in Tel-Hashomer. Mapping Mutations in HIV RNA
Today’s Topics • HIV – What is it and how it operates. • What so important about the HIV DNA mutations? • Extracting the RNA sequence for analyze. • Naïve view of the HIV RNA sequences • Locating the RNA mutations • Analysis of the RNA mutation interactions
Virus Overview Viruses may be defined as acellular organisms whose genomes consist of nucleic acid, and which obligately replicate inside host cells using host metabolic machinery and ribosomes to form a pool of components which assemble into particles called VIRIONS, which serve to protect the genome and to transfer it to other cells.
Virus Overview • The concept of a virus as an organism challenges the way we define life: • viruses do not respire, • nor do they display irritability; • they do not move • and nor do they grow, • however, they do most certainly reproduce, and may adapt to new hosts.
What is an HIV • human immunodeficiency virus, A type of retrovirus that is responsible for the fatal illness Acquired Immunodeficiency Syndrome (AIDS) • Retrovirus – A virus that's carry their genetic material in the form of RNA rather than DNA and have the enzyme reverse transcriptase that can transcribe it into DNA. • In most animals and plants, DNA is usually made into RNA, hence "retro" is used to indicate the opposite direction
How does the HIV infects the body cells? • HIV begins its infection of a susceptible host cell by binding to the CD4 receptor on the host cell • The genetic material of the virus, which is RNA, is released and undergoes reverse transcription into DNA, which enters the host cell nucleus where it can be integrated into the genetic material of the cell. • Activation of the host cells results in the transcription of viral DNA into messenger RNA (mRNA), which is then translated into viral proteins. • The viral RNA and viral proteins assemble at the cell membrane into a new virus. • The virus then buds forth from the cell and is released to infect another cell.
Treatment related to the active RNA sites • The HIV DNA generates proteins that are essential to the virus life-cycle. Medical treatment interfere or block the operation of these proteins. • Reverse Transcriptase medicines: Inhibits the transcription of the HIV RNA into the cell’s DNA • The HIV protease protein, is required to process other HIV proteins into their functional forms. Protease inhibitors medicines, act by blocking this critical maturation step.
RNA mutations • Environmental/Biological processes may cause mutations in the HIV RNA. • The mutated HIV RNA merge into the infected cell’s DNA. • The generated Amino-Acids sequence is then altered. • A different Protein is generated by the cell. • The altered protein may resist the medical treatment!
Mutation families • The HIV RNA has a high mutation rate(a 1000 times more than a regular cell). • Fast evolutionary processes causes the best mutated viruses to increase their population in the infected body. • We’ll focus on 3 main mutation families: • Resistance mutations • Clade mutations • Other – noise/random
The importance of identifying the resistance mutations • Selecting the best medicine treatments • Understanding the way different medicines interacts with the HIV • Understanding the functional interpretation of the RNA sequence
Extracting the RNA Sequence • The RNA sequences are transcript into DNA sequences. • The DNA sequences then multiplied several times • A DNA sequencer ‘read’ the aligned DNA sequences. • The decision how to interpret a specific DNA segment is based over image processing algorithms (define the segment boundaries and find the best match for the segment pattern) and isn’t deterministic!
Sequence Alignment • Before alignment AtaaagakagggggacagctaaaagaggctctcTTAGACACAGGAGCAGATGATACA ACTCTTTGGCAGCGaCCCCGTTGTCACaATAAAAATagGGGGACAGCTAAgGGagGc TAAAAGAGGCTCTCTTAGCACACAGGMGCAGAYGAYACAGTMCTTASCAAGAAATAA ACTCTTTGGCAGCGACCCCTTGTcACAATAAAAGTAGAGGGACAGCTAAGGGAKGCT ACTCTTTGGCAGCGaCCCCTTGTCACAATAAAAATAGGGGACAGCTAAGGGAGGCTC ACTCTTTGGcAGCGACCCCTtGTCACAATAAAAGtAGGGGGaCAGCTAAAgGAGGCT aCTnTTnGRCAGCGaCCCCTTgTCYCARtAAAAATAGGGGGGCAGRTAARGGAGGCt • After Alignment ------------------------------ATAAAGAKAGGGGG-ACAG-CTAAAAGAGG ------------C-GACCCC--TTGTCACAATAARAATAGGGGG-ACAG-CTAAAAGAGG ACTCTTTGGCAAC-GACCCC--TTGTCACAATAAGAGTAGGGGG-ACAG-CTAAAAGAGG -CTCTTTGGCAAC-GA-CCCC-TTGTCACAGTAAAAATAGRAGG-ACAG-CTAAAAGAAG ACTCTTTGGCAAC-GA-CCCC-TTGTCACAGTAAAAATAGGAGG-ACAG-CTAAAAGAAG ACTCTTTGGCAAC-GA-CCCC-TTGTCACAGTAAAAATAGGAGG-ACAG-CTMAAAGAAG ACTCTTTGGCAAC-GA-CCCC-TTGTCACAGTAAGAATAGGAGG-ACAG-CTAAAAGAAG • Degapping ---------------------------ATAAAGAKAGGGGGACAGCTAAAAGAGGC ------------CGACCCCTTGTCACAATAARAATAGGGGGACAGCTAAAAGAGGC ACTCTTTGGCAACGACCCCTTGTCACAATAAGAGTAGGGGGACAGCTAAAAGAGGC -CTCTTTGGCAACGACCCCTTGTCACAGTAAAAATAGRAGGACAGCTAAAAGAAGC ACTCTTTGGCAACGACCCCTTGTCACAGTAAAAATAGGAGGACAGCTAAAAGAAGC ACTCTTTGGCAACGACCCCTTGTCACAGTAAAAATAGGAGGACAGCTMAAAGAAGC ACTCTTTGGCAACGACCCCTTGTCACAGTAAGAATAGGAGGACAGCTAAAAGAAGC ACTCTTTGGCAACGACCCCTTGTCACAGTAAGAATAGGAGGACAGCTAAAAGAAGC
Reduction from Bio problem to CS Problem • Generation of a consensus RNA sequence. • For each sequence, generate a matching binary sequence, each 1 represents a mismatch between the consensus and the original sequence, and 0 represents a match. • Now we have a binary feature vector for each sample. • We can now calculate the correlations between the mutations to the treatment and between the mutations to themselves.
So where are the problems? • Curse of dimensionality • Noisy data • Sequenced data are of stochastic nature • Small number of samples • Clades and sub-clades • Vague definitions of independent variables values. • Silent mutations • Talk Bio language!
Filtering the Data • Mutations that occur less than 5 times in a specific RNA index cannot considered significant (we’ll see it later in the Chi square slides) • We’ll filter all the mutations that occur less than 3 times and replace them with the consensus value. • Thus filtering much of the noise.
Naïve clustering of Data Clustering of 671 RNA samples using Centroid linkage Total Cases A C B Clade Distribution Treated Non-Tr Treatment Distribution Cluster Size 120 9 12 59 8 29 215 65 147 7 671
Feature Extraction • Better to have misdetection than a false alarm. • Filter the noisy data • Work within the clades • Locate the mutations (features) that are highly correlate with treatment. • Now we have only few dozens of features to work on.
Finding mutations and treatment correlation • We want to find for each RNA index i whether P(Mut_in_i) is significantly different from P(Mut_in_ i/ Treatment). • We’ll use the CHI square distribution test for each index to find that.
Chi Square Overview • We will use the Chi-Square test to check the probability that our observed results had came from the same statistical population as the expected (chance) results. • A probability of less than 0.05 means that the results are significant, I.e the populations are significally different .
Chi Square Calculations • Calculating the chi-square statistic – • The probability Q that a X2 value calculated for an experiment with d degrees of freedom (where d=k-1) is due to chance is:
Calculating the mutations Correlations Matrix • Because the treatment is a major artifact in all the treatment mutations, we’ll have to find the correlations within the treated samples: • P(mut_A/Treat.) ~ P(mut_A/mut_b,Treat.) • Our Chi-Square table will be (all in treated cases)–
Example – Mutation D30N • D30N is an important resistance mutation. But it appears at frequency of 0.0258 in the C clade compare with 0.0945 in the B clade, What’s the explanation for this? • Correlation analysis reveals that in clade B, D30N is highly correlated with other resistance Mutations. In clade C it’s not. • One assumption can be that the Clade B structure can influence the connections between resistance mutations.
Using CART to find mutations interactions • A regression tree is a sequence of questions that can be answered as yes or no, plus a set of fitted response values. Each question asks whether a predictor satisfies a given condition. • In our research we will ask whether a mutation i (1 value at i index), predicts the existence of mutation j (1 value at j index). • This way we can identify relationships between the mutations.
Using clustering to find mutations patterns • We’ll cluster the mutation sample vectors in order to locate mutation patterns. • Our distance function will be the sum of differences between two samples. • We’ll use the ward method to cluster nodes.
Ward Clustering • Centroid linkage uses the distance between the centroids of the two groups: • Where and Xs defined similarly. • Ward linkage uses the incremental sum of squares; that is, the increase in the total • within-group sum of squares as a result of joining groups r and s. It is given by • Where drs is the distance between cluster r and cluster s defined in the Centroid linkage. The • within-group sum of squares of a cluster is defined as the sum of the squares of the distance between all objects in the cluster and the centroid of the cluster.
Using clustering to find mutations patterns • When we filter the mutation only to significant ones, we can see mutations pattern as a result of clustering - Samples Mutations
What’s next? • Biological interpretation of the findings: • Locating Amino-Acid and protein functional changes. May lead to better understand of resistance behavior. • Identifying new resistance mutations and specific treatment/resistance correlations. • Focus on specific treatments, apply additional research in order to investigate the efficiency of such treatment.
The End! Thank you for listening