CAIT Climate Analysis Indicators Tool
19.10.2005 Esther Lahme ECOFYS Cologne. CAIT Climate Analysis Indicators Tool. http://cait.wri.org/. Outline. What is CAIT & who developed CAIT? What indicators & GHG data are included in CAIT? Where does the data in CAIT come from? What kind of analysis can be done in CAIT?

CAIT Climate Analysis Indicators Tool
E N D
Presentation Transcript
19.10.2005 Esther Lahme ECOFYS Cologne CAIT Climate Analysis Indicators Tool
Outline • What is CAIT & who developed CAIT? • What indicators & GHG data are included in CAIT? • Where does the data in CAIT come from? • What kind of analysis can be done in CAIT? • What countries & regions are included in CAIT?
What is CAIT? Information & analysis tool on global climate change • Provides database GHG & indicators • Data can be used to support future policy decisions CAIT products free of charge • CAIT (online) • CAIT-UNFCCC (GHG emissions UNFCCC Parties) • CAIT-V&A (vulnerability and adaptive capacity) • CAIT-Excel (download, interface Microsoft Excel)
Who developed CAIT? WRI • Climate, Energy & Pollution Program of the World Resources Institute developed by Kevin A. Baumert and Matthew Markoff of WRI contribution Odile Blanchard (LEPII-EPE) and Niklas Höhne (ECOFYS) financial support of the U.S. Environmental Protection Agency, the Wallace Global Fund and the Prospect Hill Foundation
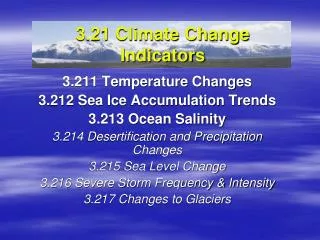
What indicators are included? • GHG Emissions • Socio-Economic • Natural Factor
What indicators are included? GHG Emissions • Historical responsibility • cumulative emissions • contribution to concentration or temperature increase • Annual emissions
Sector level GHG (CAIT) Energy 5 sub sectors Industrial processes Agriculture Land-use change Forestry Waste International bunkers What GHG emissions are included? GHG Emissions by Sector in 2000, CO2, CH4, N2O, PFCs, HFCs, SF6(excludes land use change)
Socio-Economic Education Health C intensity electricity production energy use economy Income and Economy GDP per capita GDP total Governance What indicators are included?
Natural Factor Population Climatic conditions Heating needs Cooling needs Geography Land area Natural resources Energy mix Fuel reserves What indicators are included?
Where does the data come from? • CAIT many sources • United Nations • International Energy Agency • World Bank • Carbon Dioxide Information Analyis Center • Earthtrends • Special Report on Emission Scenarios • IPCC • ... http://cait.wri.org/links.php • CAIT UNFCCC only UNFCCC
Data quality Reputable national/ international sources Some weaknesses Data constraints Lack of geographic coverage Uncertainties (LUC, Non CO2 gases) More information „info“ buttons on pages http://cait.wri.org/links.php Where does the data come from?
What analysis can be done? • Rank data or countries • In/ Exclusion of data or countries • Analysis features
What analysis can be done? Analysis features • Trends • Data • Graphs
What analysis can be done? Analysis features • Comparisons • 2 Indicators – all countries • 2 Countries – all indicators
What analysis can be done? Analysis features • Graph
What countries and regions are included? • 192 countries • 8 geographic regions (Asia, Europe, World,...) • 17 UNFCCC regions (Annex I, G-77/China,...) • 5 user specified regions
CAIT V & A Population in areas below 5 m evaluation