
Image Segmentation: Techniques and Approaches
E N D
Presentation Transcript
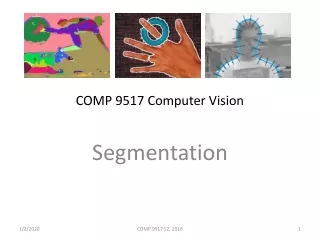
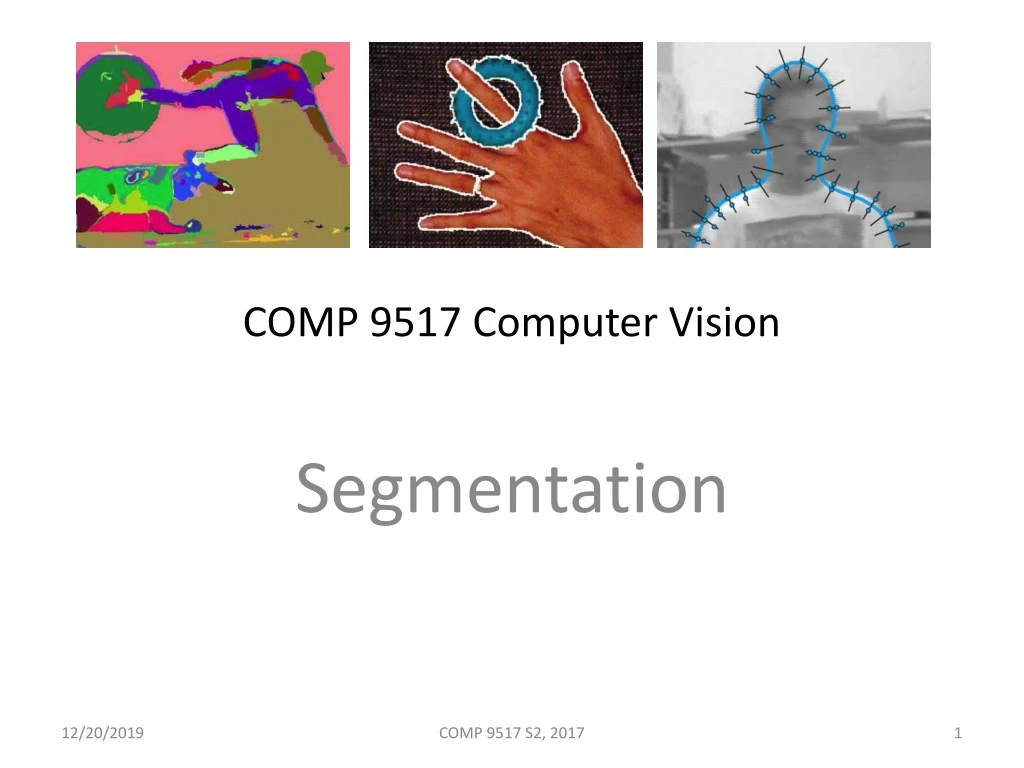
COMP 9517 Computer Vision Segmentation COMP 9517 S2, 2017
Introduction • What can you see from this image? COMP 9517 S2, 2017
Introduction • Image segmentation • one of the oldest and most widely studied problems in computer vision COMP 9517 S2, 2017
Introduction • Image segmentation the partition of an image into a set of regions • Meaningful areas • Border pixels grouped into structures • Groups of pixels with shapes • Foreground and background Background Structures, Shapes Foreground COMP 9517 S2, 2017
Introduction • Two objectives of segmentation • Decompose the image into parts for further analysis • Represent the image using meaningful and/or efficient higher-level units for further analysis Hang Ring COMP 9517 S2, 2017
Introduction • Identifying Regions • Regions should be uniform and homogeneouswith some characteristic • Region interiors should be simple and without many small holes • Adjacent regions should have significantly different values with respect to the characteristics on which they are uniform • Boundaries of each segment should be smooth and spatially accurate COMP 9517 S2, 2017
Introduction • Segmentation approaches • Region-based • Curve-based • Early techniques tend to use region splitting and/or merging • Recent algorithms optimise some global criterion COMP 9517 S2, 2017
Introduction • Issues • There is no single segmentation system working well for all problems so far • Special domain knowledge of the application is typically essential for the implementation of computer vision applications Source: http://www.isbe.man.ac.uk/~bim/Models/asms.html COMP 9517 S2, 2017
Introduction • Results from some popular segmentation techniques • Active contours • Level sets • Graph-based merging • Mean shift • Normalised cuts • Binary MRF COMP 9517 S2, 2017
Region Split and Merge • Overview • Recursively splitting the whole image into pieces based on region statistics • Recursively merging pixels and regions together in a hierarchical fashion • Combine both splitting and merging together COMP 9517 S2, 2017
Region Split and Merge • The simplest possible techniques • use a threshold and then compute connected components • rarely sufficient due to lighting and intra-object statistical variations COMP 9517 S2, 2017
Split and Merge • Watershed • A technique related to thresholding • Operate on a grayscale image • Segment an image into several catchment basins - regions of an image where rain would flow into the same lake • Start flooding the landscape at all of the local minima and to label ridges whenever different evolving components meet • Often used as part of an interactive system where the user first marks seed locations that correspond to the centres of different desired components COMP 9517 S2, 2017
Split and Merge • Watershed • Meyer’s flooding algorithm • Choose a set of markers to start the flooding, each is given a different label • The neighbouring pixels of each marked area are inserted into a priority queue with a priority level corresponding to the gray level of the pixel • The pixel with the highest priority level is popped from the queue. If the neighbours of the popped pixel that have already been labelled all have the same label, the pixel is labelled with the label. All non-labelled neighbours that are not yet in the queue are put into the queue. • Repeat step 3 until the queue is empty • The non-labelled pixels are the watershed lines COMP 9517 S2, 2017
Split and Merge • Watershed COMP 9517 S2, 2017
Split and Merge • Region Splitting • One of the oldest techniques in computer vision • First computers a histogram for the whole image • Then finds a threshold that best separates the large peaks in the histogram COMP 9517 S2, 2017
Split and Merge • Region Splitting • Repeated until regions are either fairly uniform or below a certain size • More recent approach often optimise some metric of intra-region similarity and inter-region dissimilarity COMP 9517 S2, 2017
Split and Merge • Histogram-based methods • follows a measurement-space clustering process • assumes homogeneous objects in the image appear as the clusters in measurement space (histogram) • The measurement-space clustering can be accomplished by determining the valleys in the histogram and declaring the clusters to be the interval of values between valleys COMP 9517 S2, 2017
Split and Merge • Histogram-based methods • segmentation is accomplished by mapping the clusters back to the image domain • maximum connected components of the cluster labels constitute the segments COMP 9517 S2, 2017
Split and Merge • Histogram-based methods • The measurement-space clustering can be accomplished by determining the valleys in the histogram and declaring the clusters to be the interval of values between valleys ? ? ? ? COMP 9517 S2, 2017
Split and Merge • Perform histogram mode seeking first on the whole image • and then on each of the regions obtained from the resultant clusters • until regions obtained cannot be decomposed further • A recursive version of histogram-based clustering COMP 9517 S2, 2017
Split and Merge • Region Merging • Merge regions based on their relative boundary lengths and the strength of the visible edges at the boundaries • Link clusters together based either on the distance between their closest points, their farthest points or some thing in between • Merge adjacent regions whose average colour difference is below a threshold or whose regions are too small • A useful pre-processing stage to make higher-level algorithms faster and more robust COMP 9517 S2, 2017
Split and Merge • Graph-based Segmentation • Use relative dissimilarities between regions to merge • Start with a pixel-to-pixel dissimilarity measure such as intensity differences between N8 neighbours • Internal difference • Difference between regions • Merge any two adjacent regions whose difference is smaller than the minimum internal difference of these two regions COMP 9517 S2, 2017
Split and Merge • Graph-based Segmentation COMP 9517 S2, 2017
Region Representation • The outputs from segmentation methods need to be represented and stored • Methods to represent regions: • Labelled images (the most commonly used) • Overlays • Boundary coding • Quad trees • Property tables COMP 9517 S2, 2017
Region Representation • Labelled images • Assign each detected region a unique identifier (an integer) COMP 9517 S2, 2017
Region Representation • Labelled images • Create an image where all the pixels of a region will have its unique identifier as their pixel value COMP 9517 S2, 2017
Region Representation • Overlays • Overlaying some colour or colours on top of the original image COMP 9517 S2, 2017
Region Representation • Boundary Coding • Represents regions by their boundaries in a data structure instead of an image • A linear list of the border pixels • Chain code • Polygon approximation COMP 9517 S2, 2017
Region Representation • Boundary Coding • Encoding schema • Start point • Chain code links • Chain code representation • Polygon approximation COMP 9517 S2, 2017
Region Representation • Boundary Coding • Encoding schema • Start point • Chain code links • Chain code representation • Polygon approximation 8-N 4-N COMP 9517 S2, 2017
Region Representation • Boundary Coding • Encoding schema • Start Point • Chain code links • Chain code representation • Polygon approximation COMP 9517 S2, 2017
Region Representation • Boundary Coding • Encoding schema • Start Point • Chain code links • Chain code representation • Polygon approximation COMP 9517 S2, 2017
Region Representation • Boundary Coding • Encoding schema • Start Point • Chain code links • Chain code representation • Polygon approximation Chain Code: 2223446756701 COMP 9517 S2, 2017
Region Representation • Quadtrees • A quadtree is a tree data structure in which each internal node has exactly four children • Quadtrees are most often used to partition a two dimensional space by recursively subdividing it into four quadrants or regions COMP 9517 S2, 2017
Region Representation • Quadtrees • A space-saving representation encoding the whole region • Each region of interest would be represented by a quadtree structure. I A B C D COMP 9517 S2, 2017
Region Representation • Quadtrees • Encoding Schema • Split the image • Create the tree COMP 9517 S2, 2017
Region Representation • Quadtrees • Encoding Schema • Split the image • Create the tree COMP 9517 S2, 2017
Region Representation • Quadtrees • Encoding Schema • Split the image • Create the tree I A D B C A B C D A B C D A B C D A B C D A B C D A B C D A B C D A B C D COMP 9517 S2, 2017
Region Representation • Quadtrees • Each node of a quadtree representing a square region in the image has one of three labels: Full, Empty or Mixed • Only mixed nodes have child nodes M M M M M E E M F E E M E M F E E M E E E E E E F E E F F E F E F F E F E COMP 9517 S2, 2017
Region Representation • Property Tables • Represent a region by its extracted properties rather than by its pixels • Properties can be the size, shape, intensity, colour or texture of the region 0 2 1 3 COMP 9517 S2, 2016
References and Acknowledgements • Chapter 3, 5 Szeliski 2010 • Shapiro and Stockman 2001 • Some images drawn from Szeliski 2010 and other papers COMP 9517 S2, 2016