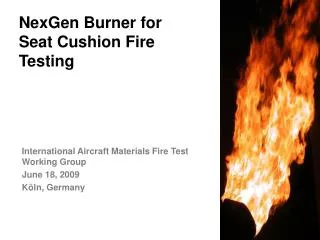
NexGen Burner Comparative Testing
NexGen Burner Comparative Testing. Objectives. Perform comparative burnthrough testing to determine the effect of various parameters on test results Use picture frame sample holder and PAN material to determine burnthrough performance

NexGen Burner Comparative Testing
E N D
Presentation Transcript
Objectives • Perform comparative burnthrough testing to determine the effect of various parameters on test results • Use picture frame sample holder and PAN material to determine burnthrough performance • Test results will help to determine which parameters are most critical when specifying the burner in the new workbook
Establish Baseline Dataset 3.43% Standard Deviation 3.17% Standard Deviation
Burnthrough Time Repeatability
Test Series 1 - Summary The choke was relocated approximately 6’ from the burner and a curved, flexible hose was added between the muffler and the burner Test results indicate no noticeable deviation from the baseline configuration
Test Series 2 – Burner Cones • Objective is to determine which cone parameters have an effect on burnthrough time • Thickness • Flange • Material • Age • Besides the baseline cone, three additional cones were tested (all new) • Baseline Cone: 0.06” thickness with recessed flange • Cone #1: 0.048” thickness 18 gauge 310 Stainless Steel • Cone #2: 0.061” thickness 321h Stainless Steel • Cone #3: Same as Cone #1 with 1” flange welded on exit plane
Cones Cone #1 Cone #2 Cone #3
Cone Surface Temperature Measurement TC5 TC4 TC3 TC2 TC1
Cone Surface Temperature Comparison Un-Insulated Cone Insulated Cone
Flame Temperature Comparison Un-Insulated Cone Insulated Cone
Summary - Insulated Cone • Insulating the cone increases the average flame temperature by about 85°F • Insulation increased the cone surface temperatures by 500-600°F • The insulated cone burned through the PAN material significantly quicker than the un-insulated cone • 8579: 92 sec. quicker • 8611: 92 sec. quicker • Cone insulation used as an extreme example to determine how heat loss from cone can affect burnthrough results
Installed Cone #10.048” thickness 18 gauge 310 Stainless Steel
Installed Cone #10.048” thickness 18 gauge 310 Stainless Steel Baseline Cone Cone #1
Installed Cone #10.048” thickness 18 gauge 310 Stainless Steel
Installed Cone #20.061” thickness 321h Stainless Steel Baseline Cone Cone #2
Installed Cone #3Same as Cone #1 with 1” flange welded on exit plane
Installed Cone #3Same as Cone #1 with 1” flange welded on exit plane Baseline Cone Cone #3
Installed Cone #3Same as Cone #1 with 1” flange welded on exit plane
Cone Comparison - Summary • All cases tested reduced the burnthrough time of both 8579 and 8611 from the baseline case • In order of impact on burnthrough severity • Insulating outer cone surface to prevent heat loss • 1” flange on end of cone • Slightly thicker cone material • New cone
Re-run Baseline Tests 244 ± 5% 231.8<x<256.2 298 ± 5% 283<x<313
Test Series #3 - Stator Definitions “New Stator” Marlin Engineering, symmetric, CNC-machined “Old Stator” Marlin Engineering CNC-machined reproduction of original Monarch H-215
New Stator • Initially new stator was put in exact position as old stator • 4” back from nozzle tip • Centerline between vanes aligned 35° from vertical • Ignition wires were removed from burner completely
Summary of Initial New Stator Results • New Stator – Flame Temperature Measurement • More uniform flame temperature profile • Significant improvement on #1 T/C • Over 50°F increase in average flame temperature • New Stator – Burnthrough Tests • Longer overall burnthrough times for both 8579 and 8611 material • 8579 – 16.45 sec. longer • 8611 – 33.60 sec. longer
Stator Rotation: ΔT=Tmax-Tmin • ΔT is used to determine the uniformity of the flame temperature measurement, smaller ΔT, more uniform profile
Stator Rotation - Summary Rotating the stator over 90° in 15° increments resulted in slightly different flame temperature profiles The uniformity of the flame was assessed by subtracting the minimum temperature from the maximum temperature The best uniformity was found at 0°, with a spread of 70.36°F