Download
1 / 26
260 likes | 441 Vues
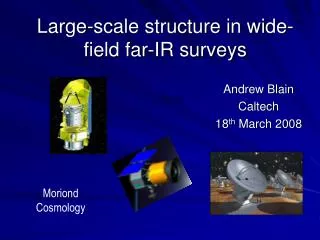
Large-scale structure in wide-field far-IR surveys. Andrew Blain Caltech 18 th March 2008. Moriond Cosmology. Contents. Accurate measurements of large-scale structure provides constraints on wide range of cosmology questions. Want to see growth from z>7 to 0

E N D
Large-scale structure in wide-field far-IR surveys Andrew Blain Caltech 18th March 2008 Moriond Cosmology
Contents • Accurate measurements of large-scale structure provides constraints on wide range of cosmology questions. Want to see growth from z>7 to 0 • Multiwavelength approach: radio/mm SZ; near-IR/optical starlight; X-ray gas • Traced out by luminous matter: HI & X-ray gas, stars, dust… • Weak lensing offers pure mass-based selection now, in future mass measurements. • But, even if cosmology is known, we will still don’t understand the details of galaxy assembly, and the effects of environment • Likely most important in regular bound clusters: established in the biased high-z regions where clusters will eventually form • Dust reprocesses about 50% of the energy released over the Universe’s history • Less now than at z~2 • Both star formation and AGN activity are responsible • Accompanied by molecular (and fine-structure atomic) gas emission • More important at greater luminosities, especially >1013 Lo • Identifying structure from the presence of the most luminous galaxies (SMGs)
Identifying distant LSS • SZ can work, X-ray is tough • Most luminous dusty galaxies at high-z (SMGs) seem to be clustered strong clustering, likely to indicate their location in the densest regions • Mechanism for triggering extreme luminosity? • Identify very luminous galaxies: • To study their astrophysics • To signpost the densest regions • To understand foreground map for CMB experiments • Discover from Spitzer, ground-based submm • Locate using radio image (ultimately ALMA) • Find redshift in optical (ultimately ALMA)
Integrated extragalactic background • Many sources of data • Total far-IR and optical background intensity are comparable • Most of the submm (0.8mm) background is detected from luminous galaxies at z~2-3 • Everywhere background known to about a factor of 2 SCUBA Model: BJSLKI ‘ Models: BJSLKI 99
Redshift distribution N(z) for radio-pinpointed SMGs • Red histogram: Chapman et al’s Keck redshifts • Lines: expected submm & radio N(z)’s from Chapman’s model • Magenta shade at z~1.5 is ‘spectroscopic desert’: rest-UV & rest-optical lines both hard to observe • Blue shading at highest z is incompleteness due to radio non-detection. Likely modest, but uncertain • 73 redshifts • Median z=2.4 and spread in redshift z~0.65 is good description Chapman et al. (2005 ApJ 622 772)
Clustering: expectations & models • N-body simulations track mass well (greyscale) • Red labelled galaxies (ellipticals) form earlier, and are most clustered • Relating submm galaxies is more difficult, and not so far done convincingly z=2 Prediction difficulties: Strong feedback Rare well-studied examples Uncertain astrophysics 1 Mpc ~ 100 arcsec at high z
SMGs trace 3D large-scale structure (LSS) peaks? • Largest number of SMGs are in and around the HDF-N • HDF & GOODS frames show where morphology information is available • Circles: all known radio-submm galaxies • Small empty: no z attempt • Large empty: no z found • Black filled: z found • Colored filled: ‘associations’ - all z’s within 1200 km/s • Green points (z=1.99) match optical galaxy z spike (Steidel et al) • Only the spectroscopic redshifts from Keck’s LRIS reveal structure • Many more ‘clusters’ or associations than expected from our knowledge of SMG N(z)
Comparison with other populations • Other more numerous high-z populations are less clustered • Are SMG redshift associations linked to overdensities of other more numerous galaxy classes at the same redshift? • Links with optically selected galaxies at z~2 in HDF • Narrow-band imaging with Keck-LRIS has found associated line-emitting optical galaxies • Do they reside in such massive halos? • Not every 10’ field can contain such an object • What is the nature of the biasing process? • Near-IR spectra hint at central 4-kpc dynamical masses of few 1011Mo • Stellar population fitting implies few 1010Mo but uncertainties from complex morphology • Keck-OSIRIS resolved spectra will be exciting After Overzier et al. (2003)
Highlighting overdense regions • Correlation length suggests very massive halos • Although small number of fields / area • But, abundance of massive halos is too great in these narrow (10’) pencil beams by factor of ~10-100 • Reason for bias could tell us about triggering the most luminous galaxies • Follow-up imaging identifies distribution of less-luminous companions • Follow-up spectroscopy identifies velocity dispersion, astrophysics • Wider-field surveys - SCUBA-2, Herschel • Deeper surveys - CCAT, ALMA • Shorter wavelengths (stars & hot dust) - Spitzer, WISE
WISE (PI Ned Wright) • Launch May 2009 • Final Delta II/III flight • All-sky survey from outward-looking low earth orbit • 47 arcmin swath • Hope for 2.5 6-month all-sky maps • 3.5, 4.9, 12, 24 m • Depth similar to SWIRE • Finder for JWST • LSS via 3.5/4.9 colors and 24 m catalog wise.ssl.berkeley.edu ~0.4m aperture 1k2 detectors
CCAT: future submm telescope • Existing submm facilities are limited to ~2mJy sensitivities by confusion noise • CSO JCMT APEX • Note ALMA has great sensitivity, but small field of view • Large format detectors are possible • SCUBA-2 soon to be deployed with 4x64x40 bolometers • Zmuidzinas et al’s ‘kinetic inductance devices’ - microwave addressed detectors using mobile phone switch technology - could be >>10002 pixels • Detectors for a larger single-aperture ground-based telescope, and moving towards a large space-based cold aperture telescope • Caltech-Cornell Atacama Telescope (CCAT) study (submm.org) • Best possible site, and atmospheric transmission to 200 microns • Wide field of view (~30 arcmin) to accommodate new detector technology
Summary • Most luminous galaxies seem to be found in densest regions • Highlighting these regions should allow many clusters to be found • Understanding astrophysics of galaxy formation requires this work, independent of whether LSS is revealed • Area surveyed will soon grow • 2008 SCUBA-2 survey plans (but follow-up painful) • 2009 Herschel ~600 square degrees (OT key project Eales) • 2009 Planck - all sky, bright point high-z sources
Unique mm/submm access to highest z • Redshift the steep submm SED • Counteracts inverse square law dimming • Detect high-z galaxies as easily as those at z~0.5 • Low-z galaxies do not dominate submm images • Unique high-z access in mm and submm • Ultimate limit at z~10 is set by CMB heating • 2mJy at 1mm ~5x10¹² Lo • Note matches current depth of submillimeter surveys • ALMA has no effective limit to depth
Example of current single-antenna submm image • Abell 1835 • Hale 3-color optical • 850-micron SCUBA • Contrast: • Image resolution • Visible populations • Orthogonal submm and optical views • One of 7 images from Smail et al. SCUBA lens survey (97-02) • About 25 other SCUBA cluster images • Both bright sources have redshifts (2.5 and 2.3; Ivison et al. 2000 & G P Smith priv comm) Ivison et al. (2000) 2.5’ square
Population of dusty galaxies • Most data is at 850 µm • New bright limit from Barnard et al (0405156) • Very few are Galactic contaminating clouds • First 2.8mm limit from BIMA • Bright 95 (&175) µm counts from ISO being dramatically improved at 70 & 160 µm by Spitzer (started August 04 ApJS) • Also recent data at 1.2mm (IRAM’s MAMBO); 1.1mm (CSO’s BOLOCAM) and 350/450µm (SCUBA & SHARC-2) * * * Orange stars – Barnard et al (2004) 850-µm upper limits
30x30” 10x10” CO examples 25x25” • SAFIR field exceeds extent of the ISO image, yet has spatial resolution as good as the inteferometer, plus spectral information Tacconi et al (2006), Neri et al. (2003), Greve et al. (2005) K band image (8” square), with IRAM CO contours of an ultraluminous galaxy at z=3.35 Upper: submm continuum; lower optical HST Genzel et al. (2004) Abell 851
SEDs: full & zoom of IRAC-24 region • SED peak wave-length ranges over factor 3 • No nice stellar SED peak in IRAC, no neat spectral breaks/features... • All SMG photometric redshifts need care Normalised to 60 & 100 quantity from the far-IR:radio relation IRAC & MIPS-24 zoomed plot Radio-far-IR relation seems OK
Resolved ‘example’: the Antennae ISOCAM 15m • Excellent example of distinct opt/UV and IR luminosity; BUT modest luminosity • Interaction long known, but great IRAS luminosity unexpected • ~90% energy escapes at far-IR wavelengths • Resolved images important • Relevant scales ~1” at high redshift CSO/SHARC-2 Dowell et al. 350m Spitzer IRAC mid-IR HST WFPC2 Multiband optical
Example IDed submm galaxy 6”x6” 20”x20” Narrow band Ivison et al (2000, 2001); Swinbank et al. (2004) • Relatively bright in optical, complex • May not see most important region in the optical - Spitzer IRAC can also highlight interesting locations • Both J1n & J2 are at z = 2.55 – radio and mm appear to be from J1n
Global luminosity evolution • Points • Blue: optical / UV • Red: IR and dust corrected • Black: SDSS fossil record • Uncertainty remains • Lines: • results from combined submm/far-IR information • Note high-z decline certain • Less rapid than for QSOs? • Caveats • AGN power (modest?) • High-z / high-L IMF change • Submm-selected sample probes most intense epoch of galaxy evolution directly WMAP cosmology
CCAT: Speed vs other instruments • ALMA, SCUBA-2, 50-m LMT, Herschel • Assume CCAT cameras • 1100, 870, 740, 620, 450, 350, 200 microns • SWCAM 32000 pixels • LWCAM 16000 pixels • Fastest depth ~few mJy at 1100 microns • FOV 25 arcmin2 • 1mJy 5σ in 30s • 1/2-sky survey in 2.5 yr • 108 galaxies • Confusion limited (350micron) • 0.05mJy 1σ in 600s • 2 deg2 in 40hr • 106 galaxies over few yr • Huge galaxy surveys • CMB foreground maps
Morphologies for examples of SMGs • GOODS images of SMGs with redshifts 3.4-1.9 • Only radio detected examples included, so positions accurate • Wide range of sizes, but typically larger than optically-selected galaxies at same redshift • Range of colors, typically interacting and complex • All detected by Spitzer-IRAC • Often as double sources Smail et al. (2004) ApJ, 616, 71 Borys et al (in prep)
Overcoming confusion • Current missions in black • Spitzer is + • Green bar is just a 500m baseline ALMA • Purple bar is ground-based 25-m CCAT • Red bar is 10-m SAFIR • Confusion from galaxies not met for many minutes or hours • At shortest wavelengths very deep observations are possible • Factor 2 increase in resolution over existing facilities is very powerful • Submm confusion dives at 5” ▬ ▬ ▬
Observed far-IR/submm SEDs • Mix of different sources traces out some of the range of galaxy SED properties • Non-thermal radio • Radio-far-IR link • Thermal dust dominates luminosity • Molecular & fine structure lines carry redshift, dynamical, and physical information Normalized where sizeable sample of `submm galaxies’ are selected. Redshifts z~2-3 from Chapman et al.
Luminosity function • Based on known redshifts and fraction of population with redshifts (~50%) can see dramatic evolution from z=0 to 1 to 2.5 • Plausible connection to the luminosity function of optically-selected high-z galaxies • Lower limits as only a fraction of far-IR luminous objects are detected in UV surveys • Key goal to better understand astrophysics of galaxy formation is overall high-z LF Chapman et al. (2005 ApJ 622 772)