500 aa
0. 500 aa. A. msp1. msp2. msp3. GPI anchor signal. msp4. conserved. msp5. repeats. msp6. variable. msp7. msp9. msp10. 0. 500 aa. B. ama1. 1. 2. 3. region VI. 1. 2. maebl. region VI. eba140. region II. region II. region II. region VI. eba175. eba181.

500 aa
E N D
Presentation Transcript
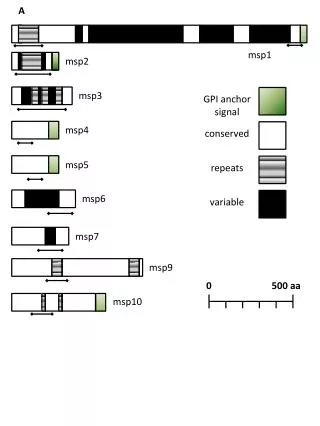
0 500 aa A msp1 msp2 msp3 GPI anchorsignal msp4 conserved msp5 repeats msp6 variable msp7 msp9 msp10
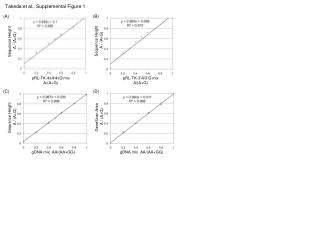
0 500 aa B ama1 1 2 3 region VI 1 2 maebl region VI eba140 region II region II region II region VI eba175 eba181 region VI PAN domains Transmembranedomain Duffy-binding-likedomains cytoplasmicregion Supplementary Figure 1: Localization of primer pairs and amplified sequences in the coding region of genes encoding tested antigens. The gene models are as extracted from PlasmoDB.org v5.5.
Supplementary Figure 2: Coomassiestained, denaturing 8% SDS-PAGE of GST fusedproteinsused in ELISAs: upper gel A: 1: GST, 2-4, MSP1 block 2 alleles RO33, MAD20 and K1, 5-7: MSP2 alleles FC27, IC1_69, IC1_3D7like, 8-9 MSP3 alleles K1 and 3D7, 10: MSP4, 11: MSP5, 12: MSP6, 13, MSP7, 14: MSP8 (nottested in ELISAs), 15: MSP9. Lower gel B: 1: GST, 2-4: MSP10, 17, 369 and 3D7, respectively, 5: AMA1_A 6: AMA1_B, 7: EBA140, 8: EBA175, 9: EBA181, 10-11: MAEBL type I4 and 3D7.
Supplementary Figure 3: Recombinant GST-fused antigens partially possess conformational epitopes which are destroyed upon heat denaturation. ELISAs were performed as before using the indicated antigens either heated for 5 min at 95°C or not. The upper graph shows the percentage of recognition of heated antigens from four strongly and two weakly reacting plasmas from asymptomatic individuals (corresponding to plasmas in lanes 4, 5, 6, 11, 12, 13 in Table 1). The lower graph shows the OD450nm values for unheated antigens. Note that the recognition of rMSP119 decreases to around 50% after heating of antigens, while EBA175 only decreases to 70% in one case (plasma 7). The recognition of MSP3 and MSP10 was not influenced by heating.
Supplementary Figure 4: Reactivity of plasmas from infections with determined MSP1-block2 alleles against antigen variants. No statistical difference was observed in the response of plasmas from carriers of the given MSP1 block 2 genotypes and their reaction against MSP1 block 2 antigens. The RO33 was the antigen with strongest recognition independent from the infecting Plasmodium genotype at the MSP1 block 2 locus, although MAD20 infected individuals reacted less to RO33 (not significant, one-way ANOVA). See Supplementary table 1 for details of the genotypes.
Supplementary Figure 5: Reactivity indices (y-axis) of sera against antigens in the follow-up analysis (day 0, 30 and 60), shown are median values (horizontal line), 25-75% percentiles (boxes) with their deviations and outliers (asterisks). Only values of antigens which were recognized statistically different between at least two time points are shown (see Table 3 for details).