Download
1 / 67
670 likes | 686 Vues
Learn about the role of biomarkers and imaging in assessing cardiovascular risk. Explore innovative approaches to predict and prevent heart disease.

E N D
Nathan D. Wong, PhD, FACC, FAHAProfessor and DirectorHeart Disease Prevention ProgramDivision of Cardiology, University of CA, IrvinePresident (2010-2012), American Society for Preventive Cardiology (ASPC) Role of Biomarkers and Imaging of Atherosclerosis for Cardiovascular Risk Assessment
Presenter Disclosures • Consultant for Re-Engineering Healthcare, Inc. • Research support through University of California, Irvine from Merck and Bristol Myers Squibb • Advisory/board consultant for Merck
Concept of cardiovascular “risk factors” Age, sex, hypertension, hyperlipidemia, smoking, diabetes, (family history), (obesity) Kannel et al, Ann Intern Med 1961
Framingham 10-year Total CVD Risk Algorithm (D’Agostino et al 2008) Low risk <10%, Intermediate risk 10-20%, High Risk >20%
The Detection Gap in CHD “Despite many available risk assessment approaches, a substantial gap remains in the detection of asymptomatic individuals who ultimately develop CHD” “The Framingham and European risk scores… emphasize the classic CHD risk factors…. is only moderately accurate for the prediction of short- and long-term risk of manifesting a major coronary artery event…” Pasternak and Abrams et al. 34th Bethesda conf. JACC 2003; 41: 1855-1917
Not all individuals with coronary heart disease have traditional risk factors Khot et al. JAMA 2003
How Good Is NCEP III in Identifying Patients at Risk for MI 1998 – 2002. 222 patients with 1st acute MI, no prior CAD, no DM. Men <55 y/o (75%), Women <65. 40% hypertensive What was NCEP risk before the MI? Would they have received statin therapy by NCEP criteria? 75% would not qualify for statin Rx Akosah JACC 2003:41 1475-9
Criteria required for a good screening test Provides an accurate determination of the likelihood that an asymptomatic person has the condition (accuracy) Reproducible results (reliability) Detect individuals where early intervention is likely to have a beneficial impact Should provide incremental value to risk predicted by office-based risk assessment Redberg and Vogel et al., 34th Bethesda Conf. JACC 2003; 41: 1855-1917
Incremental Value and Reclassification Do newer markers and measures of subclinical disease improve risk prediction, e.g., by improvement in C-statistic from ROC analyses? Can new markers accurately stratify individuals into higher or lower risk categories? Will such reclassification change how these individuals are treated? Net Reclassification Index (NRI)
Risk Reclassification with CRPFramingham Offspring Experience The NRI is the difference in proportions moving up and down among cases vs controls, or NRI = [Pr(up | case) – Pr(down | case)] – [Pr(up | control) – Pr(down | control)]. Wilson Circulation: CV Care & Outcomes 2008
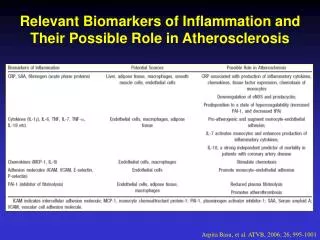
Biomarkers of Interest Inflammatory Hs-CRP LpPla2 Lipid ApoB, LDL-P, Lp(a), and LDL/HDL subclasses Cardiac BNP, Troponin, Myeloperoxidase Renal GFR, NGAL
hs-CRP as a Risk Factor For Future CVD : Primary Prevention Cohorts Kuller MRFIT 1996 CHD Death Ridker PHS 1997 MI Ridker PHS 1997 Stroke Tracy CHS/RHPP 1997 CHD Ridker PHS 1998,2001 PAD Ridker WHS 1998,2000,2002 CVD Koenig MONICA 1999 CHD Roivainen HELSINKI 2000 CHD Mendall CAERPHILLY 2000 CHD Danesh BRHS 2000 CHD Gussekloo LEIDEN 2001 Fatal Stroke Lowe SPEEDWELL 2001 CHD Packard WOSCOPS 2001 CV Events* Ridker AFCAPS 2001 CV Events* Rost FHS 2001 Stroke Pradhan WHI 2002 MI,CVD death Albert PHS 2002 Sudden Death Sakkinen HHS 2002 MI 0 1.0 2.0 3.0 4.0 5.0 6.0 Relative Risk (upper vs lower quartile) Ridker PM. Circulation 2003;107:363-9
Risk Factors for Future Cardiovascular Events: WHS Lipoprotein(a) Homocysteine IL-6 TC LDLC sICAM-1 SAA Apo B TC: HDLC hs-CRP hs-CRP + TC: HDLC 0 1.0 2.0 4.0 6.0 Relative Risk of Future Cardiovascular Events Ridker et al, N Engl J Med. 2000;342:836-43
CRP Improves Net Reclassification Index From the Physicians Health Study: hs CRP and parental history improved risk prediction 5.3% overall and 14.2% for patients at intermediate risk by traditional risk scores (both P<0.001) (Ridker et al., Circulation 2008) Framingham Heart Study: hs-CRP improved prediction of cardiovascular disease by 5.6% (P=0.014) and of coronary heart disease by 11.8% (P=0.009) (Wilson et al. Circulation: Cardiovascular Quality and Outcomes 2008).
HMG-CoA Reductase Inhibitor Evidence: Primary Prevention Justification for the Use of Statins in Prevention: An Intervention Trial Evaluating Rosuvastatin (JUPITER) 17,802 men (>50 years) and women (>60 years) with LDL-C <130 mg/dL and hs-CRP >2 mg/L randomized to rosuvastatin (20 mg) or placebo for up to 5 years* A statin provides benefit in those with elevated hs-CRP levels 0.08 Rosuvastatin Placebo Cumulative incidence of CV death, MI, CVA, hospitalization for unstable angina, and arterial revascularization 44% RRR 0.04 P<0.00001, NNT=25 0.00 0 1 2 3 4 Follow-up (years) CV=Cardiovascular, LDL-C=Low density lipoprotein cholesterol *The study was stopped prematurely after 1.9 years Ridker PM et al. NEJM 2008;359:2195-207
C-Reactive Protein Recommendations Class IIa: men >=50 years or women >=60 years of age with LDL-C<130 mg/dl, not on lipid-lowering therapy, HRT, or immunosuppressant therapy, without CHD, DM, CKD, or other contradindications, can be useful in the selection of patients for statin rx (Level of Evidence B) Class IIb:asymptomatic intermediate risk men <=50 years or women <=60 years of age measurement may be reasonable for cardiovascular risk assessment Class III: asymptomatic high risk adults or lower risk men<50 or women<60 years of age, CRP not recommended May help guide intensity of therapy in those at intermediate risk or with CHD and to a lesser extent in those with a family history of premature CHD ACCF/AHA Guideline for Assessment of Cardiovascular Risk in Asymptomatic Adults, Circulation 2010, NLA Expert Panel, J Clin Lipidology Oct 2011
Lp-PLA2 and CRP: Two Independent and Distinct Inflammatory Markers
Lp-PLA2 and vascular disease: metaanalysis of 32 studies (n=79,036) LpPLA2 Studies Collaboration (2010) Lancet 375; 1536-1544
Association of Lp-PLA2 and hs-CRP with Stroke 95% CI 3.01–24.92, p<0.001 8.66 4.69 4.26 2.64 (422) 3.47 Stroke Hazard Ratio 3.18 (310–422) 4.40 2.80 1.00 (<310) Lp-PLA2, g/L (>3) (1–3) (<1) hs-CRP, mg/L
LpPla2 Recommendations • Class IIb – Might be reasonable for cardiovascular risk assessment in intermediate risk asymptomatic adults (Level of Evidence B) • Selected higher risk pts (CHD, family hx premature CHD) • Not yet recommended for on-treatment management decisions since no randomized trials yet showing efficacy of intervention ACCF/AHA Guideline for Assessment of Cardiovascular Risk in Asymptomatic adults, Circulation 2010, NLA Expert Panel, J Clin Lipidol Oct 2011
BNP as a Predictor of Risk in Asymptomatic Adults: The Framingham Heart Study Wang et al., NEJM 2004
B-Type Natriuretic Peptides and CVD Risk (Circulation 2009; 120: 2177-2187) Meta-analysis of 40 long-term prospective studies involving 87,474 patients. Highest vs. lowest tertile, adjusted RR=2.82 (2.40-3.33). RRs similar for BNP (2.89) or NT-pro BNP (2.82) and in general populations (2.68), increased risk factors (3.35), and stable CVD (2.60). Modest improvements in risk discrimination (increase in C-statistic of 0.01 to 0.1).
Natriuretic Peptides Recommendation Class III: No benefit Measurement of natriuretic pepetides is not recommended for CHD risk assessment in asymptomatic adults (Level of Evidence B) ACCF/AHA Guideline for Assessment of Cardiovascular Risk in Asymptomatic Adults, Circulation 2010
The Future of Cardiac Biomarkers Many experts are advocating the move towards a multimarker strategy for the purposes of diagnosis, prognosis, and treatment design As the pathophysiology of ACS is heterogeneous, so must be the diagnostic strategies
A Multimarker Approach Should Focus on Multiple Mechanisms / Pathologies Circulation 108: 250-252
Additional Utility of Multiple Biomarkers for Prediction of Death: FHS ROC Curves for Death 0.82 0.80 Sensitivity 1-Specificity * HR for highest quintile v. lowest 2 quintiles Wang TJ et al. NEJM 2006;355:2631
Multiple Biomarkers for Prediction of CV Death in Older Adults Zethelius B et al. N Engl J Med 2008;358:2107-2116
Results of the biomarker score including troponin I, NT-broBNP, and C-reactive protein in the Belfast PRIME Men validation cohort Blankenberg, S. et al. Circulation 2010;121:2388-2397
Carotid B-Mode Ultrasonography • Measurement of intimal medial thickness • Non-invasive, inexpensive, no radiation • Well-established as an indicator of cardiovascular risk from epidemiologic studies • Published clinical trials on utility of carotid IMT as measure of progression of atherosclerosis and effects of therapy • Accuracy of assessments depends on experience of those interpreting scans • ACCF/AHA 2010 Guideline: CIMT measurement may be reasonable for CV risk assessment in asymptomatic adults at intermediate risk (Class IIa-B)
Cardiovascular Health Study: Combined intimal-medial thickness predicts total MI and stroke Cardiovascular Health Study (CHS) (aged 65+): MI or stroke rate 25% over 7 years in those at highest quintile of combined IMT (O’Leary et al. 1999)
0.07 0.06 0.05 0.04 Change in CIMT (mm +/- SEM) 0.03 0.02 0.01 0 ER Niacin Placebo ARBITER 2: Primary Endpoint Carotid IMT Across 12 Months • CIMT at 12 months • Statin vs ER niacin + statin P = 0.08 • Intent-to-treat analysis of statin vs. ER niacin + statin P = 0.048 • Non-Insulin resistant pts only: statin vs. ER niacin P = 0.026 68% decrease in progression Taylor AJ, et al. ARBITER 2: A double-blind, placebo-controlled study of extended-release niacin on Atherosclerosis progression in secondary prevention patients treated with statins. Circulation. 2004
Ankle-brachial blood pressure (ABI) • Simple noninvasive test to confirm lower extremity peripheral arterial disease (PAD) • Uses Doppler probe to measure SBP in brachial, posterial tibial, and dorsalis pedis arteries • ABI <0.9 in either leg is diagnostic of PAD • ACCF/AHA 2010 Guideline: Measurement reasonable for CV risk assessment in asymptomatic adults at intermediate risk (IIa-B) • Test most likely to be positive in those over 50 who have other risk factors • MEASUREMENT OF ABI: • The higher of the SBP measures taken in each arm is the denominator for the ABI calculation for each leg. • The higher of the two pressures in each ankle (from posterior tibial and dorsalis pedis arteries) forms the numerator for the left and right ABI, respectively.
Ankle Brachial Index as a Predictor of Cardiovascular Mortality in the CHS Study Newman A et al ATVB 1999
Reclassification of Risk Category from ABI (ABI Collaboration, JAMA 2008) 19% of men and 38% of women would be reclassified in their risk category from addition of ABI.
Arterial Stiffness and CVD Events in the Framingham Heart Study (Mitchell et al., Circ. 2010) After adjustment for risk factors, higher carotid-femoral pulse wave velocity (PWV) was associated with a 48% increase in CVD events over 7.8 years of follow-up.
Arterial Stiffness and CVD Events (Mitchell et al., Circulation 2010) • Addition of PWV resulted in upward reclassification of 14.3% of those with CVD events and downward reclassification of 1.4% of those without events (net reclassification of 15.7%, p=0.03). • Integrated discrimination improvement of 0.7% (p<0.05); 0.8% (p=0.02) in the intermediate risk group. • No relation to events for carotid-radial PWV, augmentation index, and central pulse pressure or pulse pressure amplification. • **************************************************************** • ACCF/AHA 2010 Guideline: Measures of arterial stiffness outside of research settings are not recommended for CV risk assessment in asymptomatic adults (Class III-C)
Coronary Calcium and Atherosclerosis: Pathology Evidence • Coronary calcium invariably indicates the presence of atherosclerosis, but atherosclerotic lesions do not always contain calcium (1-3). • Calcium deposition may occur early in life, as early as the second decade, and in lesions that are not advanced (4-5). • Correlates with plaque burden; highly sensitive for angiographic disease 1) Wexler et al., Circ 1996; 94: 1175-92, 2) Blankenhorn and Stern, Am J Roentgenol 1959; 81: 772-7, 3) Blankenhorn and Stern, Am J Med Sci 1961; 42: 1-49, 4) Stary, Eur Heart J 1990; 11(suppl E): 3-19, 5) Stary, Arteriosclerosis 1989; 9 (suppl I): 19-32.
Cumulative Incidence of Any Coronary Event: MESA Study (Detrano et al., NEJM 2008)
Risk Factor-Adjusted Hazard Ratios by Coronary Calcium Score: MESA Study (Detrano et al., NEJM 2008)
Area Under Curve for Risk Factors Alone and Risk Factors Plus CAC by Ethnic Group: MESA Study (Detrano et al., NEJM 2008)
Net Reclassification of CHD Risk by Coronary Calcium: MESA Study (Polonsky et al., JAMA 2010) The addition of CAC to models with age, gender, ethnicity and risk factors alone resulted in net reclassification of 0.25 (p<0.001); 23% of those with events were reclassified as high risk and 13% without events were reclassified as low risk.
Annual CHD Event Rates (in %) by Calcium Score Events by CAC Categories in Subjects with DM, MetS, or Neither Disease(Malik and Wong et al., Diabetes Care 2011) Coronary Heart Disease Coronary Artery Calcium Score ACCF/AHA 2010 Guideline: CAC Scoring for CV risk assessment in asymptomatic adults aged 40 and over with diabetes (Class IIa-B)
Median Annual Progression of CAC by Presence of MetS / DM: MESA (n=2735 with CAC>0 at baseline) (Wong et al., JACC Cardiovasc Imaging 2012)
Progression of CAC and CHD Events in Persons with Metabolic Syndrome, Diabetes, and Neither Condition (Wong et al., JACC Imaging, April 2012)
Indications for CAC Assessment (Greenland et al., ACCF/AHA Guideline for Assessment of Cardiovascular Risk in Asymptomatic Adults (Circulation, 2010) • CV risk assessment in asymptomatic adults at intermediate risk (10-20% 10-year risk) (Class IIa, Level of Evidence B) • CV risk assessment in persons at low to intermediate risk (6-10% 10-year risk) (Class IIb, Level of Evidence B) • CV risk assessment in asymptomatic adults with diabetes (Class IIa-B) • Persons at low risk (<6% 10-year risk) should not undergo CAC measurement for CV risk assessment (Class III, Level of Evidence B)