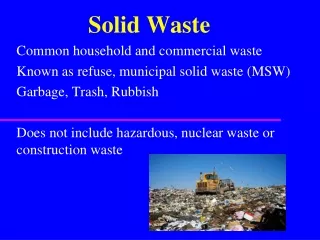
Solid Domestic Waste
Solid Domestic Waste. IB Syllabus 5.5.1, 5.5.2 AP Syllabus Ch 21 Personal Waste Audit Trashed video. Syllabus Statements. 5.5.1: Outline the types of solid domestic waste 5.5.2: Describe and evaluate pollution management strategies for solid domestic (municipal) wastes.

Solid Domestic Waste
E N D
Presentation Transcript
Solid Domestic Waste IB Syllabus 5.5.1, 5.5.2 AP Syllabus Ch 21 Personal Waste Audit Trashed video
Syllabus Statements • 5.5.1: Outline the types of solid domestic waste • 5.5.2: Describe and evaluate pollution management strategies for solid domestic (municipal) wastes
Sewage sludge 1% Mining and oil and gas production 75% Municipal 1.5% Industry 9.5% Agriculture 13% Sources of Solid Waste in the US
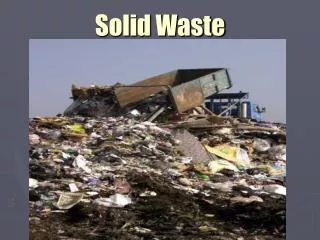
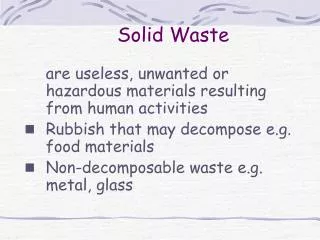
What’s in your waste? • Paper, glass, metal, plastic, organic waste (kitchen waste), packaging • 4 pounds per person per day!
The United States Extracts • 10 tons (20,000 pounds) of food, fuel, forestry products, metals and nonmetallic ores per person from U.S. territories each year. • Over 90 percent of these resources become waste (municipal and industrial) within a few months of being extracted.*
Increasingly wasteful • In 1960, per capita generation was 2.7 pounds per person while total waste generation was 88.1 million tons. • In 1980 per capita generation rose to 3.7 pounds per day while total waste generation was 121 million tons. • In 2000, the per capita generation of waste was 4.5 pounds per person per data, total waste generation was 232 million tons
Is incineration the answer? • 16% of MSW is combusted in mass burn incinerators • 80% of hazardous waste is burned in commercial incinerators • Use of incineration has decreased • High cost • Air pollution & health concerns • Public opinion is poor
Power plant Steam Smokestack Electricity Turbine Generator Crane Wet scrubber Boiler Electrostatic precipitator Furnace Conveyor Dirty water Fly ash Water Bottom ash Waste pit Conven- tional landfill Hazardous waste landfill Waste treatment
Advantages Disadvantages Reduced trash volume Less need for landfills Low water pollution High cost Air pollution (especially toxic dioxins) Produces a highly toxic ash Encourages waste production
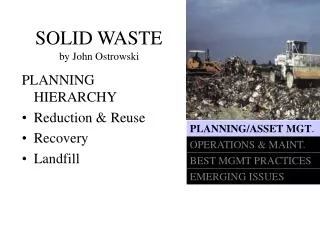
Is land disposal the solution? • 54% MSW disposed of in landfills in US • Sanitary landfill • Waste spread in thin layers; compacted; covered daily with fresh foam or clay • Lined landfills prevent groundwater contamination • Pipes vent gasses which build up • Leachate from older landfills contaminates water bodies & aquifer
Leachate monitoring well Leachate monitoring well Leachate pumped up to storage tanks for safe disposal Leachate pumped up to storage tanks for safe disposal Groundwater monitoring well Groundwater monitoring well Groundwater Leachate pipes Groundwater Leachate pipes When landfill is full, layers of soil and clay seal in trash Electricity generator building Methane storage and compressor building Topsoil Leachate treatment system Sand Clay Garbage Pipe collect explosive methane gas used as fuel to generate electricity Methane gas recovery Leachate storage tanks Compacted solid waste Garbage Sand Synthetic liner Clay and plastic lining to prevent leaks; pipes collect leachate from bottom of landfill Sand Clay Subsoil
Advantages Disadvantages No open burning Little odor Low groundwater pollution if sited properly Can be built quickly Low operating costs Can handle large amounts of waste Filled land can be used for other purposes No shortage of landfill space in many areas Noise and traffic Dust Air pollution from toxic gases and volatile organic compounds release greenhouse gases (methane and CO2) Groundwater contamination Slow decomposition of wastes Encourages waste production Eventually leaks and can contaminate groundwater
Can we close the loop • Making the process greener requires the use of negative feedback • Need to recycle or compost to turn the waste into a useful product
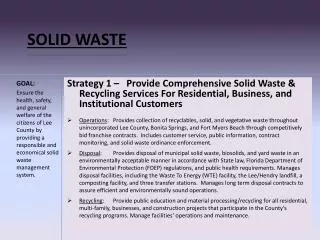
Recycling • Every ton of recycled paper saves 17 trees, 7,000 gallons of water, 4,100 kWh energy and 3 cubic yards of landfill space • 30.1% of US municipal solid waste is now recycled • 45% of paper, 26% of glass, <20% plastic, 55% aluminum cans • Plastic is hard because there are 46 different kinds • Some areas promote it by a pay per bag approach to non recycled trash
Recycling problems • Some food containers are not made for easy recycling – juice boxes • Some toxic sludge from non recyclable parts • Some products that could be made from recycled materials aren’t • http://kleercut.net/en/node/324= Kleenex clearcut
Composting • Allowing for the complete breakdown of biodegradable materials • Creates humus – highly valuable fertile material • Example of upcycling of waste
Other Methods • Deep well injection • Liquid wastes are pumped into porous rock below aquifers • Surface impoundments • Pits or ponds for liquid hazardous waste storage • 70% in US have no liner • Secure waste storage facilities • Above or below ground – reinforced concrete • Exporting hazardous wastes • Pay poor countries to take it off our hands
Mercury: A Waste Case Study • Potent neurotoxin – harm nervous system of developing fetus • Exposure: inhaling vapors, eating contaminated fish • Human inputs: coal burning, waste incineration, furnaces for recycling • We have doubled or tripled the mercury concentration in the atmosphere
Figure 21-19Page 550 AIR WINDS PRECIPITATION WINDS PRECIPITATION Hg and SO2 Hg2+ and acids Hg2+ and acids Photo-chemical oxidation Elemental mercury vapor (Hg) Inorganic mercury and acids (Hg2+) Human sources Inorganic mercury and acids (Hg2+) Coal-burning plant Incinerator Deposition Large fish WATER Deposition BIOMAGNIFICATION IN FOOD CHAIN Deposition Vaporization Small fish Phytoplankton Zooplankton Oxidation Bacteria and acids Elemental mercury liquid (Hg) Inorganic mercury (Hg2+) Organic mercury (CH3Hg) Bacteria Settles out Settles out Settles out SEDIMENT Bacteria Natural sources Elemental mercury (Hg) Inorganic mercury (Hg2+) Organic mercury (CH3Hg) Oxidation Bacteria
Emissions control Lower allowed emissions from incinerators & coal burning plants Tax each unit of mercury emitted Remove mercury from emissions Prevention Phase out coal Remove mercury from coal before use Prohibit use of mercury in products Phase out incinerator wastes Mercury Reduction