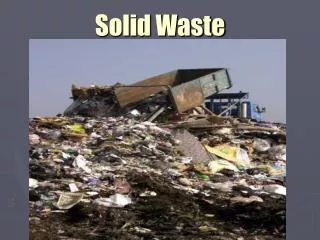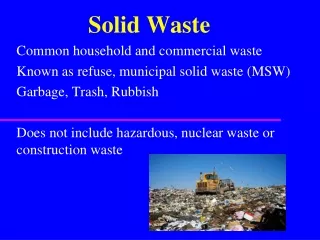
Solid Waste
Solid Waste. Consumption for Average U.S. Citizen over a 70 year life span. 623 tons coal, oil, natural gas 613 tons sand, gravel, stone 26 million gallons of water 21,000 gallons of gasoline 51 tons of metals 50 tons of food 48 tons of wood 19 tons of paper

Solid Waste
E N D
Presentation Transcript
Consumption for Average U.S. Citizen over a 70 year life span • 623 tons coal, oil, natural gas • 613 tons sand, gravel, stone • 26 million gallons of water • 21,000 gallons of gasoline • 51 tons of metals • 50 tons of food • 48 tons of wood • 19 tons of paper • 5.2 tons of syn. Plastic, rubber, fibers • 5 tons fertilizer
Waste for Average U.S. Citizen over a 70 year life span • 840 tons of agricultural waste • 823 tons of garbage, industrial & mining wastes • 7 million gallons polluted water • 70 tons of air pollutants • 19,250 bottles • 19,000 cans • 7 automobiles
Major categories of U.S. Solid Waste Agricultural Waste Mining Waste Industrial Waste Municipal Waste
Major categories of U.S. Solid Waste Agricultural Waste 56% Mining Waste 34 % Industrial Waste 6% Municipal Waste 4%
Components of Agricultural Waste • Crop residues – anything that is not harvested and used for food, fiber or energy • Animal wastes – includes manures and carcasses • Pesticide & Herbicide residues • Old equipment and fuel residues
How can these be disposed of? • Crop residues – composting, plowing into the soil (increases organic matter), or burning • Animal wastes – composting, fertilizers, pyrolysis • Heating under very high temperatures and pressures to get oil • Other wastes are landfilled or disposed of insitu
Components of Mining Waste • Tailings!
Why are there so many tailings • When you find the ore you are interested in, it will be combined with other rocks, not as pure form. • After you dig up the raw ore, it is pulverized and the material of interest is extracted, leaving behind the tailings • The purest ore that is found is taconite, a form of iron. Its concentration is 30%, leaving 70% tailings! • Most ores contain 1% or less of the material of interest.
Why are there so many tailings, continued Strip mines make even more tailings than under- Ground mines. Left over soil can become tailings here along with Mining ‘waste’.
Legislation and efforts to reclaim mining areas • 1977 – Surface mining control and reclamation act (one of the first efforts) • Land must be restored to its original contours and use • Mining banned on prime agricultural land • Effects on local watersheds must be minimized
What can be done with tailings? • Because of their thin, powdery nature, this is tricky – also contaminated with heavy metals such as lead, zinc, cadmium, etc. These are toxic. • Ceramics – especially high temperature tiles for furnaces • Road surface materials • Building materials (e.g. concrete blocks)
What can be done with tailings? • Only specific tailings can be used for a specific purpose due to their complex chemistry. • Some tailings can contain radioactive compounds like radon and must therefore be used with extreme care!
Components of Industrial Waste • This is where we think of things such as chemical waste, toxic wastes, etc. • The EPA estimates that only 10% of toxic wastes are disposed of properly. • Some of these wastes are getting into local drinking water supplies, food supplies, and ecosystems……..
1927 Arrow Shows Canal Location
History of Love Canal • 1942 – 1952 Hooker Chemical dumped 21,000 tons of chemicals in the old canal in steel drums and then covered them with fill dirt. • This was legal at the time. • 1953 Hooker forced to sell canal area to Niagara School Board for $1! • Did so under duress – stated that canal area was NOT safe! • School board had several realtors on it.
History of Love Canal • Between 1953 and 1977 an elementary school and 239 homes were built on or near the canal, followed by a major subdivision of 710 homes • 1977 extremely heavy rains – chemicals start leaching into basements • In the meantime the area had higher than normal rates of cancers and birth defects
1980 Canal Note homes built next to and near canal.
History of Love Canal • 1978 – residents evacuated from canal area after over 200 different compounds are found • New York State spends $37 million relocating the 239 families closest to canal • Federal government relocates the remaining 710 families • RCRA begins
You Betcha! • Look at the handout • Go over the flow chart
Municipal Wastes • These can also be hazardous! • Therefore, as of October 9, 1993, solid waste facilities will be constructed as… Methane collection system
How else can municipal waste be disposed of? • Incineration • Waste to energy programs • Burn waste and generate steam to power an electric power plant • Burn methane from waste in city vehicles or to make electricity
Reduce, Reuse, Recycle • Since waste in the U.S. is primarily paper, a large proportion of it can be recycled • If it not contaminated with food or covered with the clay-based inks seen in “shiny” magazines, etc. • With the amount of yard waste in Norman being reduced by the compost facility, citizens get a rebate from state government on their bill every month