Information System Analysis
Explore observation, questionnaires, and interviews as data gathering methods in system analysis. Learn how each technique works, its types, procedures, and key guidelines. Dive into process modeling, data flow diagrams (DFD), symbols used in DFDs, and guidelines for developing effective DFDs.

Information System Analysis
E N D
Presentation Transcript
Information System Analysis Topic-2
Data Gathering • Observations • Questionnaires • Interviews
Data Gathering \ Observation • Observation usually means just that –watching and seeing • See firsthand the relationships that exist between decision makers and other organizational members.
Data Gathering \ Observation • Types of data gathered this way cannot easily be collected by other techniques. • The key advantage of observation is firsthand information: You can take notes that describe the activities as they occur.
Data Gathering \ Questionnaires • Questionnaires are special-purpose documents that allow the analyst to collect information and opinions from respondents.
Data Gathering \ Questionnaires Types of Questionnaires:- • Free-format questionnaires:- Offer the respondent greater latitude in the answer. • Fixed-format questionnaires:- Contain questions that require selection of predefined responses from individuals. Example:-Multiple-choice questions
Data Gathering \ Questionnaires Questionnaires Procedure:- • Determine what facts and opinions must be collected and from whom you should get them. • Based on the needed facts and opinions, determine whether free or fixed-format questions will produce the best answers. • Write the questions
Data Gathering \ Questionnaires Questionnaires Procedure:- • Test the questions on a small sample of respondents. • Duplicate and distribute the questionnaires
Data Gathering \ Interviews • Interviews are a fact-finding technique whereby the systems analysis collect information from individuals through face-to-face interaction.
Data Gathering \ Interviews Types of Interviews :- • Unstructured interviews are conducted with only a general goal or subject in mind and with few, if any, specific questions. • In structured interviews the interviewer has a specific set of questions to ask of the interviewee.
Data Gathering \ Interviews Types of Interview Questions :- • Open-ended questions allow the interviewee to respond in any way that seems appropriate. • Closed-ended questions restrict answers to either specific choices or short direct responses.
Data Gathering \ Interviews Procedure to conduct an Interview :- • Select interviewees. • Prepare for the Interview • Conduct the Interview • Follow up on the Interview
Data Gathering \ Interviews Interview Question Guidelines :- • Use clear and concise language. • Don’t include your opinion as part of the question. • Avoid long or complex questions. • Avoid threatening questions. • Don’t use “you” when you mean a group of people.
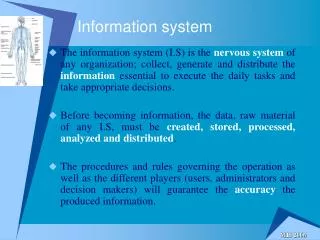
Process Modeling • Process modeling involves graphically representing the processes, or actions, that capture, manipulate, store, and distribute data between a system and its environment and among components within a system.
Data Flow Diagram (DFD) • It is a graphic that illustrates the movement of data between external entities and the processes and data stores within a system. • DFD can represent both physical and logical information systems. • DFD are versatile diagramming tools. With only four symbols, represent data flows, data stores, processes, and sources/sinks (External Entities)
DFD’s Symbols \ External Entities • Represent people or organizations outside of the system being studied • Shows the initial source and final recipient of data and information • Should be named with a noun, describing that entity
DFD’s Symbols \ External Entities • External entities may be: • A person, such as CUSTOMER or STUDENT. • A company or organization, such as BANK or SUPPLIER. • Another department within the company, such as ACCOUNT DEPARTMENT. • Another system or subsystem, such as the INVENTORY CONTROL SYSTEM.
DFD’s Symbols \ Processes • It is the work or actions performed on data so that they are transformed, stored, or distributed. • Represent either: • A whole system, or A subsystem • Work being done, an activity • Names should be in the form verb-adjective-noun • Note:- when modeling the data processing of a system, it doesn’t matter whether a process is performed manually or by a computer.
DFD’s Symbols \ Data Store • Name with a noun, may represent one of many different physical locations for data. To understand data movement and handling in a system. • Data stores are usually given a unique reference number, such as D1, D2, D3. • Include any data stored, such as: • A computer file or database. • A set of tables . • A manual file of records.
DFD’s Symbols \ Data flow • Data flow shows the data about a person, place, or thing that moves through the system. • Names should be a noun that describes the data moving through the system. • Arrowhead indicates the flow direction.
Developing DFD Use the following guidelines: • Make a list of activities and use it to determine (External Entities, Data Flows, Process, Data Stores) • Create the context level diagram, including all external entities and the major data flow to or from them.
Developing DFD Use the following guidelines: • Create Diagram 0 by analyzing the major activities within the context process. • Include the external entities and major data stores. • Create a child diagram for each complex process on Diagram 0 (Level 1). • Check for errors and make sure the labels you assign to each process and data flow are meaningful.
Creating The Context Diagram • It contains only one process, representing the entire system. • The process is given the number zero. • All external entities are shown on the context diagram as well as major data flow to and from them. • The diagram does not contain any data stores.
Creating Diagram 0 • Diagram 0 is the explosion of the context level diagram. • It should include up to 7 or 9 processes. • Any more will result in a cluttered diagram. • Processes are numbered with an integer. • The major data stores and all external entities are included on Diagram 0.
Creating Child Diagram • Each process on diagram zero may be exploded to create a child diagram. • These diagrams found below Diagram 0 are given the same number as the parent process. • Process 3 would explode to Diagram 3. • Each process is numbered with the parent diagram number, and a unique child diagram number. • Examples are: 3.2 on Diagram 3, the child of process 3. On Diagram 3, the processes would be numbered 3.1, 3.2, 3.3 and so on.
Creating Child Diagram • External entities are usually not shown on the child diagrams below Diagram 0. • If the parent process has data flow connecting to a data store, the child diagram may include the data store as well. • Each process on a lower-level diagram may be exploded to create another child diagram. • A lower-level diagram may contain data stores not shown on the parent process, such as: • A file containing a table of information (such as a tax table).
DFD \ Rules • Basic rules that apply to all DFDs: • Inputs to a process are always different than outputs • Objects always have a unique name • In order to keep the diagram uncluttered, you can repeat data stores and data flows on a diagram
DFD • Process • No process can have only outputs (a miracle) • No process can have only inputs (black hole) • A process has a verb phrase label • Data Store • Data cannot be moved from one store to another • Data cannot move from an outside source to a data store • Data cannot move directly from a data store to sink • Data store has a noun phrase label
DFD • Source/Sink • Data cannot move directly from a source to a sink • A source/sink has a noun phrase label • Data Flow • A data flow has only one direction of flow between symbols • A fork means that exactly the same data go from a common location to two or more processes, data stores, or sources/sinks
DFD • Data Flow (Continued) • A join means that exactly the same data come from any two or more different processes, data stores or sources/sinks to a common location • A data flow cannot go directly back to the same process it leaves • A data flow to a data store means update • A data flow from a data store means retrieve or use • A data flow has a noun phrase label
Data Dictionary • This supplements the DFD by giving an organized listing of all data elements in the system. • It describes the meaning of the data flows and stores on the DFD. • It describes the composition of aggregate packets of data moving along the flows e.g. address might be described as house number, street, town, country etc.
Data Dictionary • The data dictionary is a reference work of data about data (metadata) • It collects, coordinates, and confirms what a specific data term means to different people in the organization.
Data Dictionary The data dictionary may be used for the following reasons: • Provide documentation. • Eliminate redundancy. • Validate the data flow diagram. • Provide a starting point for developing screens and reports. • To develop the logic for DFD processes.
Data Dictionary Data dictionaries contain: • Data flow. • Data structures. • Elements. • Data stores.
Data Dictionary Data structures: • Data structures are a group of smaller structures and elements. • An algebraic notation is used to represent the data structure.
Data Dictionary \ Notation • =Consist of • +and • ( ) “Parentheses” optional ( may or may not be present ) • { } “Braces” iteration ( repeated a number of times ) • [ ] “Brackets” (select one of several alternatives ) • ** a comment. • @ identifier ( key field for a store ) • | (separates the choices in [ ])
Data Dictionary \ Notation Data Dictionary example Customer Name = First Name + (Middle Initial) + Last Name Address = Street + (Apartment) + City + State + Zip + (Zip Expansion) + (Country) Telephone = Area code + Local number
Data Dictionary \ Notation Data Dictionary example • name = title + first_name + ( middle_initial ) + last_name. • title = [Mr|Mrs|Ms|Miss|Dr|Prof] • first_name = { legal_characters } • middle_initial = aplha_character. • last_name = { legal_characters } • legal_characters = [A-Z|a-z|’| |] • alpha_character = [A-Z] • name = * name for dispatch purposes *
Data Dictionary Data Elements:- • Data elements should be defined with descriptive information, length and type of data information, validation criteria, and default values. • Each element should be defined once in the data dictionary.