BIRD POPULATIONS
EXAMPLE 3. Write an equation to model data. BIRD POPULATIONS.

BIRD POPULATIONS
E N D
Presentation Transcript
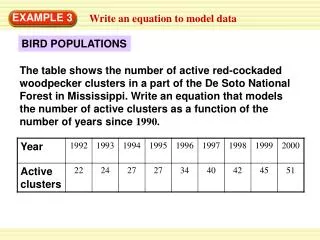
EXAMPLE 3 Write an equation to model data BIRD POPULATIONS The table shows the number of active red-cockaded woodpecker clusters in a part of the De Soto National Forest in Mississippi. Write an equation that models the number of active clusters as a function of the number of years since 1990.
Make a scatter plot of the data. Let xrepresent the number of years since 1990. Let yrepresent the number of active clusters. EXAMPLE 3 Write an equation to model data SOLUTION STEP 1
EXAMPLE 3 Write an equation to model data STEP 2 Decide whether the data can be modeled by a line. Because the scatter plot shows a positive correlation, you can fit a line to the data. STEP 3 Draw a line that appears to fit the points in the scatter plot closely. STEP 4 Write an equation using two points on the line. Use (2, 20) and (8, 42).
42 – 20 y2 – y1 11 22 m = = = 8 – 2 = 3 x2 – x1 6 y = mx + b Substitute for m, 2 for x, and 20 for y. 11 20 = (2) + b 3 11 3 EXAMPLE 3 Write an equation to model data Find the slope of the line. Find the y-intercept of the line. Use the point (2, 20). Write slope-intercept form.
= b 38 11 38 11 38 3 3 3 3 3 x + x + . An equation of the line of fit is y = ANSWER The number yof active woodpecker clusters can be modeled by the function y = where xis the number of years since 1990. EXAMPLE 3 Write an equation to model data Solve for b.
3. Use the data in the table to write an equation that models yas a function of x. Sample answer: y = 1.6x + 2.3 ANSWER for Example 3 GUIDED PRACTICE