Performance Analysis Necessity or Add-on in Grid Computing
Performance Analysis Necessity or Add-on in Grid Computing. Michael Gerndt Technische Universität München gerndt@in.tum.de. LRR at Technische Universität München. Chair for Computer Hardware & Organisation / Parallel Computer Architecture (Prof. A. Bode)

Performance Analysis Necessity or Add-on in Grid Computing
E N D
Presentation Transcript
Performance AnalysisNecessity or Add-on in Grid Computing Michael Gerndt Technische Universität München gerndt@in.tum.de
LRR at Technische Universität München • Chair for Computer Hardware & Organisation / Parallel Computer Architecture (Prof. A. Bode) • Three groups in parallel & distributed architectures • Architectures • SCI Smile project • DAB • Hotswap • Tools • CrossGrid • APART • Applications • CFD • Medicine • Bioinformatics
Outline PA on parallel systems Scenarios for PA in Grids PA support in Grid projects APART
Performance Analysis for Parallel Systems • Development cycle • Assumption: Reproducibility • Instrumentation • Static vs Dynamic • Source-level vs object-level • Monitoring • Software vs Hardware • Statistical profiles vs Event traces • Analysis • Source-based tools • Visualization tools • Automatic analysis tools Coding Performance Monitoringand Analysis Program Tuning Production
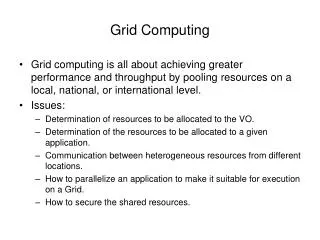
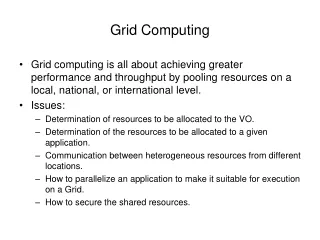
Grid Computing • Grids • enable communities (“virtual organizations”) to share geographically distributed resources as they pursue common goals -- assuming the absence of… • central location, • central control, • omniscience, • existing trust relationships. [Globus Tutorial] • Major differences to parallel systems • Dynamic system of resources • Large number of diverse systems • Sharing of resources • Transparent resource allocation
Scenarios for Performance Monitoring and Analysis • Post-mortem application analysis • Self-tuning applications • Grid scheduling • Grid management [GGF performance working group, DataGrid, CrossGrid]
Post-Mortem Application Analysis • George submits job to the Grid • Job is executed on some resources • George receives performance data • George analyzes performance • Requires • either resources with known performance characteristics (QoS) • or system-level information to assess performance data • scalability of performance tools • Focus will be on interacting components
Self-Tuning Applications • Chris submits job • Application adapts to assigned resources • Application starts • Application monitors performance and adapts to resource changes • Requires • Integration of system and application monitoring • On-the-fly performance analysis • API for accessing monitor data (if PA by application) • Performance model and interface to steer adaptation (If PA and tuning decision by external component.)
Grid-Scheduling • Gloria determines performance critical application properties • She specifies a performance model • Grid scheduler selects resources • Application is started • Requires • PA of the grid application • Possibly benchmarking the application • Access to current performance capabilities of resources • Even better to predicted capabilities
Grid-Management • George claims to see bad performance since one week. • The helpdesk runs the Grid performance analysis software. • Periodical saturation of connections is detected. • Requires • PA of historical system information • Need to be done in a distributed fashion
New Aspect of Performance Analysis • Transparent resource allocation • Dynamism in resource availability • Approaches in the following projects: • Damien • Datagrid • Crossgrid • GrADS
Analyzing Meta-Computing Applications • DAMIEN (IST-25406), 5 partners www.hlrs.de/organization/pds/projects/damien/ • Goals • Analysis of GRID-enabled applications • using MpCCI (www.mpcci.org) • using PACX-MPI (www.hlrs.de/organization/pds/projects/pacx-mpi) • Analysis of GRID components • PACX-MPI and MpCCI • Extend Vampir/Vampirtrace technology
Application code (MPI_Send) Name shift (CPP) Compiled code (PACX_Send) Routine call MetaVT wrapper (PACX_Send) Routine call Tracefile GRID-MPI profiling routine (PPACX_Send) Native MPI GRID communication layer MetaVampirtrace for Application Analysis
Application code (MPI_Send) Name shift (CPP) Compiled code (PACX_Send) Routine call GRID-MPI layer (PACX_Send) Routine call MetaVT wrapper (MPI_Send) Tracefile MPI profiling routine (PMPI_Send) TCP/IP GRID-MPI communication layer MetaVampirtrace for GRID Component Analysis
Metacomputer Node 1 Node 2 MPI processes GRID–Daemons Send Recv SMP node 1 SMP node 2 P_1 P_n P_1 P_n All MPI Processes MetaVampir • General counter support • Grid component metrics • Hierarchical analysis • Analysis at each level • Aggregate data for groups • Improves scalability • Structured tracefiles • Subdivided into frames • Stripe data across multiple files
eventpublicationinformation Consumer Directory Service Producer eventpublicationinformation Grid Monitoring Architecture • Developed by GGF Performance working group • Separation of data discovery and data transfer • Data discovery via (possibly distributed) directory service • Data transfer among producer – consumer • GMA interactions • Publish/subscribe • Query/response • Notification • Directory includes • Types of events • Accepted protocols • Security mechanisms
R-GMA in DataGrid • DataGrid www.eu-datagrid.org • R-GMA www.cs.nwu.edu/~rgis • DataGrid WP3 hepunx.rl.ac.uk/edg/wp3 • Relational approach to GMA • Producers announce: SQL “CREATE TABLE” publish: SQL “INSERT” • Consumers collect: SQL “SELECT” • Approach to use the relational model in a distributed environment • It can be used for information service as well as system and application monitoring.
P-Grade and R-GMA • P-GRADE Environment developed at MTA SZTAKI • GRM (Distributed monitor) • Prove (Visualization tool) • GRM creates two tables in R-GMA • GRMTrace (String appName, String event): all events • GRMHeader (String appName, String event): important header events only • GRM Main Monitor • SELECT “*” FROM GRMHeader WHERE appName=“...” • SELECT “*” FROM GRMTrace WHERE appName=“...”
User’s Host Main Monitor PROVE Connection to R-GMA R-GMA Site Host 1 Host 2 ApplicationProcess Appl.Process Appl.Process
Analyzing Interactive Applications in CrossGrid • CrossGrid funded by EU: 03/2002 – 02/2005 www.eu-crossgrid.org • Simulation of vascular blood flow • Interactive visualization and simulation • response times are critical • 0.1 sec (head movement) to 5 min (change in simulation) • Performance analysis • response time and its breakdown • performance data for specific interactions
CrossGrid Application Monitoring Architecture • OCM-G = Grid-enabled OMIS-Compliant Monitor • OMIS = On-line Monitoring Interface Specification • Application-oriented • Information about running applications • On-line • Information collected at runtime • Immediately delivered to consumers • Information collected via instrumentation • Activated / deactivated on demand • Information of interest defined at runtime (lower overhead)
th_stop(P1,P2) th_stop(P3) th_stop(P4,P5) Stop Stop Stop Stop Stop P1 P4 P2 P5 OMIS Performance Tool th_stop(Sim) Service Manager LM LM LM P3
Application Specific Measurement • G-PM offers standard metrics • CPU time, communication time, disk I/O, ... • Application programmer provides • Relevant events inside application (probes) • Relevant data computed by the application • Association between events in different processes • G-PM allows to define new metrics • Based on existing ones and application specific information • Metric Definition Language under development • Compilation or interpretation will be done by High-Level Analysis Component.
Managing Dynamism: The GrADS Approach • GrADS (Grid Application Development Software) • Funded by National Science Foundation, started 2000 • Goal: Provide application development technologies that make it easy to construct and execute applications with reliable [and often high] performance in the constantly-changing environment of the Grid. • Major techniques to handle transparency and dynamism: • Dynamic configuration to available resources (configurable object programs) • Performance contracts and dynamic reconfiguration
GrADS Software Architecture Performance feedback Software Components Realtime perf monitor Scheduler/ Service Negotiator Grid runtime System (Globus) Config. object program Source appli- cation whole program compiler P S E negotiation Dynamic optimizer libraries Program Preparation System Execution Environment
Configurable Object Programs • Integrated mapping strategy and cost model • Performance enhanced by context-depend. variants • Context includes potential execution platforms • Dynamic Optimizer performs final binding • Implements mapping strategy • Chooses machine-specific variants • Inserts sensors and actuators • Perform final compilation and optimization
Performance Contracts A performance contract specifies the measurable performance of a grid application. Given • set of resources, • capabilities of resources, • problem parameters the application will • achieve a specified, measurable performance
Creation of Performance Contracts Program • Developer • Compiler • Measurements PerformanceModel MDS Resource Broker NWS ResourceAssignment PerformanceContract
History-Based Contracts • Resources given by broker • Capabilities of resources given by • Measurements of this code on those resources • Possibly scaled by the Network Weather Service • e.g. Flops/second and Bytes/second • Problem parameters • Given by the input data set • Application intrinsic parameters • Independent of execution platform • Measurements of this code with same problem parameters • e.g. floating point operation count, message count, message bytes count • Measurable Performance Prediction • Combining application parameters and resource capabilities
System Signature • trajectory of values through N-dimensional metric space • will vary across application executions, even on the sameresources • e.g. metric iterations/second resource capabilities Application and System Space Signature Application Signature • trajectory of values through N-dimensional metric space • one trajectory per process • e.g. one point per iteration • e.g. metric: iterations/flop
Verification of Performance Contracts Execution Sensor Data • Violation detection • Fault detection Rescheduling ContractMonitor SteerDynamic Optimizer
APART • ESPRIT IV Working Group, 01/1999 – 12/2000 • IST Working Group, 08/2001 – 07/2004 www.fz-juelich.de/apart Focus: • Network European development projects for automatic performance analysis tools • Testsuite for automatic analysis tools • Automatic Performance Analysis and Grid Computing (WP3 – Peter Kacsuk)
Summary • Scenarios • Post-mortem Application Tuning • Self-tuning applications • Grid scheduling • Grid management • How to handle transparency and dynamism? • Approaches here: • Damien: Provide static environment. • Datagrid: Combining system and application monitoring • Crossgrid: On-line analysis • GrADS: Performance models and contracts