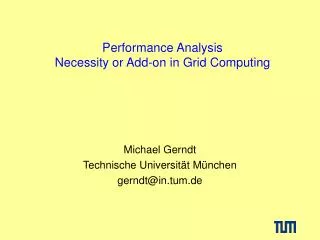
Performance Analysis Necessity or Add-on in Grid Computing
370 likes | 391 Vues
Explore the necessity and techniques of performance analysis in grid computing scenarios. Learn about tools, methodologies, and the impact on parallel systems and applications.

Performance Analysis Necessity or Add-on in Grid Computing
E N D
Presentation Transcript
Performance AnalysisNecessity or Add-on in Grid Computing Michael Gerndt Technische Universität München gerndt@in.tum.de
LRR at Technische Universität München • Chair for Computer Hardware & Organisation / Parallel Computer Architecture (Prof. A. Bode) • Three groups in parallel & distributed architectures • Architectures • SCI Smile project • DAB • Hotswap • Tools • CrossGrid • APART • Applications • CFD • Medicine • Bioinformatics
Outline PA on parallel systems Scenarios for PA in Grids PA support in Grid projects APART
Performance Analysis for Parallel Systems • Development cycle • Assumption: Reproducibility • Instrumentation • Static vs Dynamic • Source-level vs object-level • Monitoring • Software vs Hardware • Statistical profiles vs Event traces • Analysis • Source-based tools • Visualization tools • Automatic analysis tools Coding Performance Monitoringand Analysis Program Tuning Production
Grid Computing • Grids • enable communities (“virtual organizations”) to share geographically distributed resources as they pursue common goals -- assuming the absence of… • central location, • central control, • omniscience, • existing trust relationships. [Globus Tutorial] • Major differences to parallel systems • Dynamic system of resources • Large number of diverse systems • Sharing of resources • Transparent resource allocation
Scenarios for Performance Monitoring and Analysis • Post-mortem application analysis • Self-tuning applications • Grid scheduling • Grid management [GGF performance working group, DataGrid, CrossGrid]
Post-Mortem Application Analysis • George submits job to the Grid • Job is executed on some resources • George receives performance data • George analyzes performance • Requires • either resources with known performance characteristics (QoS) • or system-level information to assess performance data • scalability of performance tools • Focus will be on interacting components
Self-Tuning Applications • Chris submits job • Application adapts to assigned resources • Application starts • Application monitors performance and adapts to resource changes • Requires • Integration of system and application monitoring • On-the-fly performance analysis • API for accessing monitor data (if PA by application) • Performance model and interface to steer adaptation (If PA and tuning decision by external component.)
Grid-Scheduling • Gloria determines performance critical application properties • She specifies a performance model • Grid scheduler selects resources • Application is started • Requires • PA of the grid application • Possibly benchmarking the application • Access to current performance capabilities of resources • Even better to predicted capabilities
Grid-Management • George claims to see bad performance since one week. • The helpdesk runs the Grid performance analysis software. • Periodical saturation of connections is detected. • Requires • PA of historical system information • Need to be done in a distributed fashion
New Aspect of Performance Analysis • Transparent resource allocation • Dynamism in resource availability • Approaches in the following projects: • Damien • Datagrid • Crossgrid • GrADS
Analyzing Meta-Computing Applications • DAMIEN (IST-25406), 5 partners www.hlrs.de/organization/pds/projects/damien/ • Goals • Analysis of GRID-enabled applications • using MpCCI (www.mpcci.org) • using PACX-MPI (www.hlrs.de/organization/pds/projects/pacx-mpi) • Analysis of GRID components • PACX-MPI and MpCCI • Extend Vampir/Vampirtrace technology
Application code (MPI_Send) Name shift (CPP) Compiled code (PACX_Send) Routine call MetaVT wrapper (PACX_Send) Routine call Tracefile GRID-MPI profiling routine (PPACX_Send) Native MPI GRID communication layer MetaVampirtrace for Application Analysis
Application code (MPI_Send) Name shift (CPP) Compiled code (PACX_Send) Routine call GRID-MPI layer (PACX_Send) Routine call MetaVT wrapper (MPI_Send) Tracefile MPI profiling routine (PMPI_Send) TCP/IP GRID-MPI communication layer MetaVampirtrace for GRID Component Analysis
Metacomputer Node 1 Node 2 MPI processes GRID–Daemons Send Recv SMP node 1 SMP node 2 P_1 P_n P_1 P_n All MPI Processes MetaVampir • General counter support • Grid component metrics • Hierarchical analysis • Analysis at each level • Aggregate data for groups • Improves scalability • Structured tracefiles • Subdivided into frames • Stripe data across multiple files
eventpublicationinformation Consumer Directory Service Producer eventpublicationinformation Grid Monitoring Architecture • Developed by GGF Performance working group • Separation of data discovery and data transfer • Data discovery via (possibly distributed) directory service • Data transfer among producer – consumer • GMA interactions • Publish/subscribe • Query/response • Notification • Directory includes • Types of events • Accepted protocols • Security mechanisms
R-GMA in DataGrid • DataGrid www.eu-datagrid.org • R-GMA www.cs.nwu.edu/~rgis • DataGrid WP3 hepunx.rl.ac.uk/edg/wp3 • Relational approach to GMA • Producers announce: SQL “CREATE TABLE” publish: SQL “INSERT” • Consumers collect: SQL “SELECT” • Approach to use the relational model in a distributed environment • It can be used for information service as well as system and application monitoring.
P-Grade and R-GMA • P-GRADE Environment developed at MTA SZTAKI • GRM (Distributed monitor) • Prove (Visualization tool) • GRM creates two tables in R-GMA • GRMTrace (String appName, String event): all events • GRMHeader (String appName, String event): important header events only • GRM Main Monitor • SELECT “*” FROM GRMHeader WHERE appName=“...” • SELECT “*” FROM GRMTrace WHERE appName=“...”
User’s Host Main Monitor PROVE Connection to R-GMA R-GMA Site Host 1 Host 2 ApplicationProcess Appl.Process Appl.Process
Analyzing Interactive Applications in CrossGrid • CrossGrid funded by EU: 03/2002 – 02/2005 www.eu-crossgrid.org • Simulation of vascular blood flow • Interactive visualization and simulation • response times are critical • 0.1 sec (head movement) to 5 min (change in simulation) • Performance analysis • response time and its breakdown • performance data for specific interactions
CrossGrid Application Monitoring Architecture • OCM-G = Grid-enabled OMIS-Compliant Monitor • OMIS = On-line Monitoring Interface Specification • Application-oriented • Information about running applications • On-line • Information collected at runtime • Immediately delivered to consumers • Information collected via instrumentation • Activated / deactivated on demand • Information of interest defined at runtime (lower overhead)
th_stop(P1,P2) th_stop(P3) th_stop(P4,P5) Stop Stop Stop Stop Stop P1 P4 P2 P5 OMIS Performance Tool th_stop(Sim) Service Manager LM LM LM P3
Application Specific Measurement • G-PM offers standard metrics • CPU time, communication time, disk I/O, ... • Application programmer provides • Relevant events inside application (probes) • Relevant data computed by the application • Association between events in different processes • G-PM allows to define new metrics • Based on existing ones and application specific information • Metric Definition Language under development • Compilation or interpretation will be done by High-Level Analysis Component.
Managing Dynamism: The GrADS Approach • GrADS (Grid Application Development Software) • Funded by National Science Foundation, started 2000 • Goal: Provide application development technologies that make it easy to construct and execute applications with reliable [and often high] performance in the constantly-changing environment of the Grid. • Major techniques to handle transparency and dynamism: • Dynamic configuration to available resources (configurable object programs) • Performance contracts and dynamic reconfiguration
GrADS Software Architecture Performance feedback Software Components Realtime perf monitor Scheduler/ Service Negotiator Grid runtime System (Globus) Config. object program Source appli- cation whole program compiler P S E negotiation Dynamic optimizer libraries Program Preparation System Execution Environment
Configurable Object Programs • Integrated mapping strategy and cost model • Performance enhanced by context-depend. variants • Context includes potential execution platforms • Dynamic Optimizer performs final binding • Implements mapping strategy • Chooses machine-specific variants • Inserts sensors and actuators • Perform final compilation and optimization
Performance Contracts A performance contract specifies the measurable performance of a grid application. Given • set of resources, • capabilities of resources, • problem parameters the application will • achieve a specified, measurable performance
Creation of Performance Contracts Program • Developer • Compiler • Measurements PerformanceModel MDS Resource Broker NWS ResourceAssignment PerformanceContract
History-Based Contracts • Resources given by broker • Capabilities of resources given by • Measurements of this code on those resources • Possibly scaled by the Network Weather Service • e.g. Flops/second and Bytes/second • Problem parameters • Given by the input data set • Application intrinsic parameters • Independent of execution platform • Measurements of this code with same problem parameters • e.g. floating point operation count, message count, message bytes count • Measurable Performance Prediction • Combining application parameters and resource capabilities
System Signature • trajectory of values through N-dimensional metric space • will vary across application executions, even on the sameresources • e.g. metric iterations/second resource capabilities Application and System Space Signature Application Signature • trajectory of values through N-dimensional metric space • one trajectory per process • e.g. one point per iteration • e.g. metric: iterations/flop
Verification of Performance Contracts Execution Sensor Data • Violation detection • Fault detection Rescheduling ContractMonitor SteerDynamic Optimizer
APART • ESPRIT IV Working Group, 01/1999 – 12/2000 • IST Working Group, 08/2001 – 07/2004 www.fz-juelich.de/apart Focus: • Network European development projects for automatic performance analysis tools • Testsuite for automatic analysis tools • Automatic Performance Analysis and Grid Computing (WP3 – Peter Kacsuk)
Summary • Scenarios • Post-mortem Application Tuning • Self-tuning applications • Grid scheduling • Grid management • How to handle transparency and dynamism? • Approaches here: • Damien: Provide static environment. • Datagrid: Combining system and application monitoring • Crossgrid: On-line analysis • GrADS: Performance models and contracts