Download
1 / 13
130 likes | 258 Vues
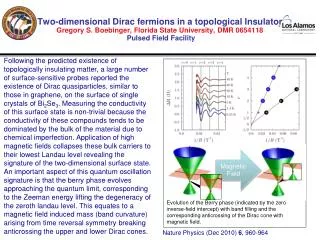
Chromospheric UV oscillations depend on altitude and local magnetic field Noah S. Heller and E.J. Zita, The Evergreen State College, Olympia, WA 98505 Philip Judge, HAO, NCAR, Boulder, CO 80301. Introduction: UV continuum emissions:.

E N D
Chromospheric UV oscillations depend on altitude and local magnetic field Noah S. Heller and E.J. Zita, The Evergreen State College, Olympia, WA 98505 Philip Judge, HAO, NCAR, Boulder, CO 80301
Introduction: UV continuum emissions: • Are brighter where gas is hotter, that is at higher altitudes: (T) and (h) decrease, since T(h) increases. • Intensity is greater in strong magnetic regions (network) • Oscillations track photospheric waves traveling up through chromosphere Image courtesy of WHO at http://WHERE Heller, Zita (TESC) and Judge (HAO), SHINE meeting, Banff CA, 2002 Aug.
Background: Photospheric oscillations Supergranules excited by convection at He+ layer: Dx~ __ Mm, Dt ~ 1 day, f << 2 mHz Granules excited by convection at H + layer: Dx~ __ Mm, Dt ~ 10 minutes, f ~ 1.5 mHz p-modes at photosphere: Dx~ __ Mm, Dt ~ 5 minutes, f ~ 3 mHz Image courtesy of WHO at http://WHERE Heller, Zita (TESC) and Judge (HAO), SHINE meeting, Banff CA, 2002 Aug.
SUMER measures UV emissions Image courtesy of WHO at http://WHERE Heller, Zita (TESC) and Judge (HAO), SHINE meeting, Banff CA, 2002 Aug.
SUMER timeseries of UV oscillations xi timeseries t Greyscale plot t x • Sumer slit… • Greyscale intensity plot for a given wavelegnth • Timeseries at a give position xi and wavelength Heller, Zita (TESC) and Judge (HAO), SHINE meeting, Banff CA, 2002 Aug.
Fourier transform frequency spectra P I power Integrated power f f • Power spectrum shows frequency peaks for each xi and l • Integrate power spectrum over all positions, for each l • Sum power over each of three frequency ranges: • LF (0-2 mHz), MF (2-5 mHz), HF (5-10) mHz Heller, Zita (TESC) and Judge (HAO), SHINE meeting, Banff CA, 2002 Aug.
Integrated power varies with wavelength (or altitude) Integrated power HF Integrated power MF Integrated power LF l l l • do this for LF, MF, HF • do it for NW and INW • note trend Heller, Zita (TESC) and Judge (HAO), SHINE meeting, Banff CA, 2002 Aug.
Trend and ratios NW/INW HF NW/INW MF NW/INW LF l l l • note trend: power decreases further from photosphere p-modes are source of UV oscillations • ratios: LF stronger in NW (granulation) • HF stronger in INW (…) Heller, Zita (TESC) and Judge (HAO), SHINE meeting, Banff CA, 2002 Aug.
DISCUSSION Heller, Zita (TESC) and Judge (HAO), SHINE meeting, Banff CA, 2002 Aug.
Nonlinearities: p-modes shocks heating p-modes transformed to magnetic waves less power to UV oscillations Heller, Zita (TESC) and Judge (HAO), SHINE meeting, Banff CA, 2002 Aug.
SUMMARY: • we did … • we see … • interpretation … • significance ... Heller, Zita (TESC) and Judge (HAO), SHINE meeting, Banff CA, 2002 Aug.
Next steps: • Compare to MDI data on local magnetic fields: • check correspondence between intense UV and strong “network” fields • investigate magnetic topology: expect p-modes to propagate freely in regions with weak or vertical fields • expect p-modes to transform to MHD waves in regions with strong and oblique fields, as evident in 2D MHD code data (Johnson, Petty-Powell, Zita) Heller, Zita (TESC) and Judge (HAO), SHINE meeting, Banff CA, 2002 Aug.
References and Acknowledgements B.C. Low, High Altitude Observatory (HAO), NCAR, http://www.hao.ucar.edu 1988 Astrophysical Journal 330, 992 E.J. Zita, 2002, The Evergreen State College, http://192.211.16.13/individuals/zita/research.htm Dick Canfield et al., 1999, Montana St. Univ., http://solar.physics.montana.edu/canfield/ This work is supported by NASA under the Sun-Earth Connection Guest Investigator Program, NRA 00--OSS--01 SEC Thanks to Dr. B.C.Low (HAO) for suggesting this sheared field for analysis, and to Dr. Tom Bogdan (HAO and NSF) for discussions and solution strategies. Heller, Zita (TESC) and Judge (HAO), SHINE meeting, Banff CA, 2002 Aug.