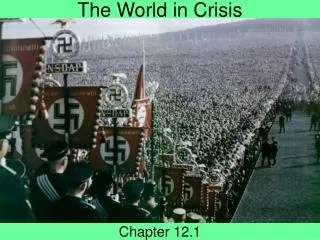
World in Crisis
World in Crisis. Global Imbalances: Inequality in the World Today Dr Malcolm Fairbrother. School of Geographical Sciences World in Crisis. The richest person in the world…?. The richest person in the world…?. Bill Gates. Carlos Slim Hel ú. Warren Buffett.

World in Crisis
E N D
Presentation Transcript
World in Crisis Global Imbalances: Inequality in the World Today Dr Malcolm Fairbrother School of Geographical Sciences World in Crisis
The richest person in the world…? Bill Gates Carlos Slim Helú Warren Buffett
The richest person in the world…? Bill Gates Carlos Slim Helú Warren Buffett (each has approx. US$60 billion, or £39 billion)
UK as a whole produces US$1,845.2 bn/year Slim/Gates/Buffett therefore possesses wealth equivalent to about 3.7% of that the UK produces US$30,821 per resident (“per capita”) each year it would take the average Briton 2,199,799 years to produce Slim/Gates/Buffett’s current wealth US$60 billion versus the UK?
the average Sierra Leonean produces about US$561/year it would take the average Sierra Leonean 120,855,615 years to produce Slim/Gates/Buffett’s current wealth (remember: 2,199,799 years for the Briton) US$60 billion vs. Sierra Leone?
Sierra Leonean economy produces: US$561/year per capita the British economy produces: US$30,821/year per capita the whole world’s economy? US$7,439/year per capita (about 6.5 billion people) The UK versus Sierra Leone versus the World?
how long would it take the average Sierra Leonean to produce what the average Briton produces in a single year (US$30,821)? 54.9 years but life expectancy at birth in Sierra Leone: 41.4 years (compare with UK: 78.9 years) The UK versus Sierra Leone?
Is inequality a problem? Is inequality growing? If it’s growing, why? If it’s growing, what might be the consequences? A Crisis of Inequality??
a situation in which units vary in their possession or control of something in other words, where there is nonzero dispersion around the mean (average) Inequality
Distributions versus What Kinds of People Are Located Where B C
things that many people want, that some people have more of than others? wealth and income health (including freedom from pain) education life (life expectancy, safety) political rights and freedoms Types of Inequality I
characteristics of people that may influence where they are located in a distribution of desirable things? gender ethnicity nationality citizenship age Types of Inequality II
income and wealth if you have it, you can probably get other good things you want (education, life, political freedom, etc.) also useful because we have relatively good data (information) we will set aside the characteristics of individuals Our Focus Today: Money
some people say we should focus on poverty, not inequality maybe we should care what happens to the poor in absolute terms, not relative to the rich a somewhat philosophical and psychological debate: do relative incomes and wealth affect individuals’ well-being? Inequality versus Poverty?
In other words: Is economic inequality increasing or decreasing? Issue at three levels: national/domestic: within countries international: between countries global: considering individuals as members of a single globe Q: Are the rich getting richer and the poor getting poorer?
it’s not easy! inaccurate national statistics, surveys, historical estimates, cross-national comparisons but accurate enough to draw some key conclusions Measuring Inequality
can just compare scores for a few cases (e.g., individuals, countries) but that gets complicated when we have many cases and/or want to compare one distribution to another so we use some key indexes of inequality… Measuring Inequality
Gini Coefficient varies from 0 to 1 0: perfect equality 1: one member has everything Gini Index is the Gini Coefficient multiplied by 100 (range of 0 to 100) Measuring Inequality:Gini Coefficient/Index
can compare the income or wealth of the 90th percentile to the 10th or the 80th percentile to the 20th both comparisons provide a ratio that tells us something about the amount of something distributed at the top versus at the bottom Measuring Inequality:Ratios of Percentiles
individuals, families, and households have incomes what about nations? usually use GDP (Gross Domestic Product) or something like it not perfect, but does tell us something useful about a country GDP/capita measures productivity Measuring Inequality:Comparing Incomes of Nations
until the Industrial Revolution: most of the world’s people were poor (even in Europe, which had the highest GDP/capita) starvation a constant threat for most most inequality was within nations, not between them A Brief History of Economic Inequality: 1800-1950
then, as a result of the Industrial Revolution: tremendous economic growth (increasing GDP/capita) in countries with industry within-nation inequality expanded but between-nation inequality expanded far more starting in early 1900s, within-nation inequality began declining in rich countries A Brief History of Economic Inequality: 1800-1950
sometime between 1950 and 1980: between-nation inequality began declining within-nation inequality began expanding however, between-nation inequality depends on how you treat two key countries: China and India in other words: Do you “weight” by population? Economic Inequality: 1950-now
we know: inequality between nations is declining (assuming you recognize China’s and India’s populations) inequality within nations is increasing Q: so which effect is stronger?? Global Inequality:Are the rich getting richer and the poor getting poorer?
A: declining between-nation inequality outweighs increasing within-nation inequality therefore… global inequality is now declining but only because of India and, even more so, China (and in the rest of the world inequality is increasing) and uncertainty about the data remains Global Inequality:Not Increasing… (We Think)
but, absolute gaps in income and wealth are growing (even if ratios are shrinking) many (poor) countries are not growing, and thus falling farther and farther behind the ones that are sub-Saharan Africa (largely because of HIV/AIDS, malaria, cholera, tuberculosis… plus conflict and political crises) billions remain in poverty (most in Asia) Global Inequality:Remaining Problems
existing research suggests that inequality leads to: less political democracy less economic development worse human health more corruption Consequences of Inequality
research has shown that inequality has a range of negative consequences economic inequality has recently been increasing within most countries but economic inequality is decreasing at the global level because it’s decreasing between countries (weighted by population) these trends are a change from earlier in the 20th century Key Conclusions
required readings: Gilbert 2007 recommended readings: Sutcliffe 2004 Firebaugh 2003 Birdsall et al 2005 my open door time for WiC: January 19, 14.00-16.00, 2.17N Readings and Further Help