Download

1 / 6
280 likes | 1.46k Vues
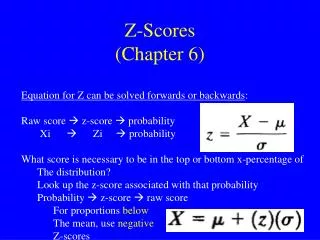
Calculating Z-scores. A z-score tells you where you are on the generic normal distribution curve Most z-scores are between -3 and 3 (because 99.7% of the data is between -3 and 3!). Finding a z-score: the formula. (where x is the data value).

E N D
Calculating Z-scores A z-score tells you where you are on the generic normal distribution curve Most z-scores are between -3 and 3 (because 99.7% of the data is between -3 and 3!)
Finding a z-score: the formula (where x is the data value) A set of Economics Final Exam Grades are normally distributed with a mean of 65 and a standard deviation of 12. Find a z-score for a grade of 70. Find a z-score for a grade of 62. Find a z-score for a grade of 49.
A set of data is normally distributed with a mean of 415 and a standard deviation of 27. Find a z-score for a data value of 400. Find a z-score for a data value of 435. Find a z-score for a data value of 482.
What percentage of data values are between the z-values of -1 and 1? Using Z-scores to Find Percentages 68% What percentage of data values are between the z-values of -1 and 0? 34% What percentage of data values are below -2? 2.5%
Find DISTR (which is above VARS—so press 2nd VARS) • Choose 2 normalcdf • You will now list 4 numbers with commas between them—Lower value, Upper Value, Mean, Standard Deviation • ENTER Using the calculator to Find Percentages Between Two Z-Values (or data values) EXAMPLE: Find the percentage that your z-score is between -2 and 2. 0.95=95% EXAMPLE: Find the percentage that your z-score is between -3 and -1. 0.16=16% EXAMPLE: Find the percentage that your z-score is between 1.5 and 1.8. 0.03=3%
Classwork—turn in when you finish! The ages of a group of people is normally distributed with a mean of 34 and a standard deviation of 4. 1. Find a z-score for a person age 30. 2. Find a z-score for a person age 37. 3. Find a z-score for a person age 23. Find each percentage (some require the calculator): 4. z-score above 3 5. z-score between -3 and -2 6. z-score between 0 and 1 7. z-score between -1 and 0.5 8. z-score between -2.7 and -1.3