z-scores
110 likes | 282 Vues
z-scores. Chapter 5. Social comparison. Upward social comparison: you’ve done worse than others in class look up at them feel badly about yourself Downward social comparison: you’ve done better than others in class look down at them feel better about yourself.

z-scores
E N D
Presentation Transcript
z-scores Chapter 5
Social comparison • Upward social comparison: you’ve done worse than others in class • look up at them • feel badly about yourself • Downward social comparison: you’ve done better than others in class • look down at them • feel better about yourself
Relevance to statistics? • Upward social comparison = your score is below the mean • Downward social comparison = your score is above the mean
But wait – there’s more • Also depends on how spread out scores are • You engage in upward social comparison, and the standard deviation is small • you feel quite badly • You engage in upward social comparison, and the standard deviation is big • you feel less bad
Comparing a score to other scores • Need to know about that score, about the mean of the group, and the standard deviation • all this is captured by z-scores (number of standard deviations a score is above or below the mean of the group it’s from) • Remember: every score in a group gets its very own z-score • Positive z-score = above mean • Negative z-score = below mean • Value of z-score = how many standard deviations above or below the mean
Calculating a z-score • +/- part, from score minus mean • positive value if above • negative value if below • zero if at the mean • Number of standard deviations away from the mean, from divide difference between score and mean by standard deviation • more variable distribution, score needs to be farther from the mean to stand out • less variable distribution, score doesn’t need to be that far from the mean to stand out • size of z-score = how much score stands out – how weird person with that score is
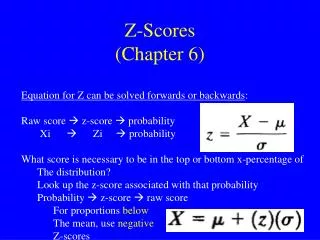
Bringing it all together • Z-score compares score to the group of scores it’s from use m rather than M and s rather than SD • z = (X – m)/s • Can also calculate raw score from z-score: • X = zs + m
Creating a standardized distribution • If turn each raw score of a distribution into a z-score standardized distribution • Mean = zero • Standard deviation = one • Shape (e.g., skewness) = exactly the same as it was before
Fun with z-scores • Compare scores across groups • Figure out percentile ranks (percentage of people who are below a particular score), if the distribution is normal • Very large + z-score will have lots of people below it • Very large – z-score will have few people below it • People with large z-scores are rare, unlikely to find
Keep in mind • Z-scores are dependent on one person’s score, and the scores of the group that person is from • The same score in a different distribution would have a different z-score • A different score in the same distribution would have a different z-score • One z-score per score • Z-score tells about one score, compared to the group that that score is from • Z-scores are in units of standard deviation