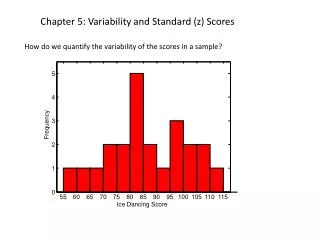
Chapter 5 z-Scores
Chapter 5 z-Scores. PowerPoint Lecture Slides Essentials of Statistics for the Behavioral Sciences Seventh Edition by Frederick J. Gravetter and Larry B. Wallnau. Chapter 5 Learning Outcomes. Concepts to review. The mean (Chapter 3) The standard deviation (Chapter 4)

Chapter 5 z-Scores
E N D
Presentation Transcript
Chapter 5 z-Scores PowerPoint Lecture SlidesEssentials of Statistics for the Behavioral SciencesSeventh Editionby Frederick J. Gravetter and Larry B. Wallnau
Concepts to review • The mean (Chapter 3) • The standard deviation (Chapter 4) • Basic algebra (math review, Appendix A)
5.1 Purpose of z-Scores • Identify and describe location of every score in the distribution • Standardize an entire distribution • Takes different distributions and makes them equivalent and comparable
5.2 Locations and Distributions • Exact location is described by z-score • Sign tells whether score is located above or below the mean • Number tells distance between score and mean in standard deviation units
Figure 5.2 Relationship of z-scores and locations
Learning Check • A z-score of z = +1.00 indicates a position in a distribution ____
Learning Check - Answer • A z-score of z = +1.00 indicates a position in a distribution ____
Learning Check • Decide if each of the following statements is True or False.
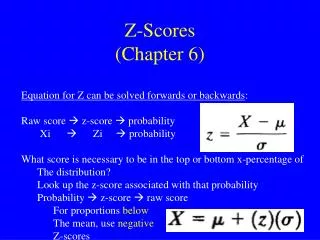
Equation for z-score • Numerator is a deviation score • Denominator expresses deviation in standard deviation units
Determining raw score from z-score • Numerator is a deviation score • Denominator expresses deviation in standard deviation units
Learning Check • For a population with μ = 50 and σ = 10, what is the X value corresponding to z=0.4?
Learning Check - Answer • For a population with μ = 50 and σ = 10, what is the X value corresponding to z=0.4?
Learning Check • Decide if each of the following statements is True or False.
5.3 Standardizing a Distribution • Every X value can be transformed to a z-score • Characteristics of z-score transformation • Same shape as original distribution • Mean of z-score distribution is always 0. • Standard deviation is always 1.00 • A z-score distribution is called a standardized distribution
Figure 5.4 Transformation of a Population of Scores
Figure 5.6 Shape of Distribution after z-Score Transformation
z-Scores for Comparisons • All z-scores are comparable to each other • Scores from different distributions can be converted to z-scores • The z-scores (standardized scores) allow the comparison of scores from two different distributions along
5.4 Other Standardized Distributions • Process of standardization is widely used • AT has μ = 500 and σ = 100 • IQ has μ = 100 and σ = 15 Point • Standardizing a distribution has two steps • Original raw scores transformed to z-scores • The z-scores are transformed to new X values so that the specific μ and σ are attained.
Figure 5.7 Creating a Standardized Distribution
Learning Check • A score of X=59 comes from a distribution with μ=63 and σ=8. This distribution is standardized so that the new distribution has μ=63 and σ=8. What is the new value of the original score?
Learning Check • A score of X=59 comes from a distribution with μ=63 and σ=8. This distribution is standardized so that the new distribution has μ=63 and σ=8. What is the new value of the original score?
5.5 Computing z-Scores for Samples • Populations are most common context for computing z-scores • It is possible to compute z-scores for samples • Indicates relative position of score in sample • Indicates distance from sample mean • Sample distribution can be transformed into z-scores • Same shape as original distribution • Same mean M and standard deviation s
5.6 Looking to Inferential Statistics • Interpretation of research results depends on determining if (treated) sample is noticeably different from the population • One technique for defining noticeably different uses z-scores.
Learning Check • Last week Andi had exams in Chemistry and in Spanish. On the chemistry exam, the mean was µ = 30 with σ = 5, and Andi had a score of X = 45. On the Spanish exam, the mean was µ = 60 with σ = 6 and Andi had a score of X = 65. For which class should Andi expect the better grade?
Learning Check - Answer • Last week Andi had exams in Chemistry and in Spanish. On the chemistry exam, the mean was µ = 30 with σ = 5, and Andi had a score of X = 45. On the Spanish exam, the mean was µ = 60 with σ = 6 and Andi had a score of X = 65. For which class should Andi expect the better grade?
Learning Check TF • Decide if each of the following statements is True or False.