Download
1 / 63
660 likes | 856 Vues
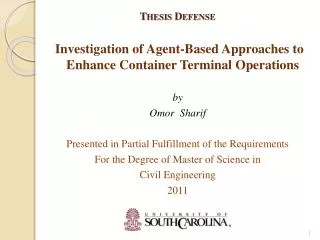
Doctoral Defense Application of Agent-Based Approaches to Enhance Container Terminal Operations by Omor Sharif Director: Dr. Nathan Huynh In Partial Fulfillment of the Requirements for the Degree of Doctor of Philosophy in Civil Engineering College of Engineering and Computing

E N D
Doctoral Defense Application of Agent-Based Approaches to Enhance Container Terminal Operations by Omor Sharif Director: Dr. Nathan Huynh In Partial Fulfillment of the Requirements for the Degree of Doctor of Philosophy in Civil Engineering College of Engineering and Computing Summer, 2013
A Very Brief Review of Container Terminal Water Side Container Yard Land Side • An interface between ocean and land transport • Containers are loaded/unloaded to/from a ship • Temporary storage of export and import containers • Operation involves a large number of decisions
Growth in Container Traffic, Major Challenges World container volumes have increased from 113 million TEU to more than 572 million TEU in the period from 1993 to 2011. An annual average growth rate of nearly 10% per year. • Limited capacity issues, Congestion • Environmental concerns, emission from congestion • Increased complexity in planning • Lack of optimized decision making tools • Competition among terminals has considerably increased • Provide satisfactory customer service, reliability • Tools that reduce cost, increase productivity of operations Optimization | Automated Equipment | Information Technology
Flow of Containers in a Container Terminal External Trucks External Trucks Yard Cranes Internal Trucks Quay Cranes Vessel Berth Customers Internal Truck Storage Area
Berth • Allocation Decision Problems in Container Terminal • Quay Crane Scheduling • Transport • Containers • Storage Assignment • Yard Crane Scheduling • Gate Operations
Three Research Topics Reduce truck processing time | Reduce congestion | Reduce emission Optimize available resources | Improve efficiency of related processes
Journal Article I Application of El Farol Model for Managing Marine Terminal Gate Congestion B by Omor Sharif, Nathan Huynh and Jose Vidal Research in Transportation Economics, 32 (1), 81-89 (2011)
Excessive Waiting of Trucks at Terminal Gates Figure: Port Elizabeth, New Jersey - Peak hour congestion at gate • Documentation processing, security checks at gate • At peak hours demand greatly exceeds supply at gate • Long waiting time results in high truck cost • Source of significant emission, unhappy truckers
Agent-based Model for Dispatch Decisions Send Truck Now??? 4 miles
El Farol Bar Problem (Arthur, 1994) Fig: A simulated 100-week record of attendance at El Farol • A bar in Santa Fe, New Mexico • Every Thursday night, everyone wants to go to the El Farol • But it's no fun to go there if, say, more than 60 go to the bar, they'll all have a worse time than if they stayed at home. • It is necessary for everyone to decide at the same time whether they will go to the bar or not • If agents use different strategies to decide, the overall attendance fluctuates at 60, which is the Nash Equilibrium
Principal Parameters of Model N ≡ Set of Depots (n ∈ N), T ≡ Set of Trucks (t ∈ T) Tolerance, L ≡ Maximum time the truck willing to wait Expected wait, E (W) ≡ The time truck thinks it will wait Make a Decision, SEND? (n, t) ≡ YES if E (W) ≤ L NO otherwise Wait at gate, W(t) = Waiting in Queue + Waiting in Service Discretization interval, I ≡ How often to make a decision? Historyx= Waiting time at terminal gate for last mintervals
Predictors are simple rules or strategies/hypotheses • Agents use predictive strategies to estimate E(W) • Sample predictors- • A random number • Positive trend of last 10 values • A periodic function • Moving average of past 5 values Estimate E(W) using ‘predictors’
Solution Steps Create: A large number of ‘predictors’ to estimate E(W) Choose: Agent chooses kpredictors from predictor space, S Estimate: Estimate E(W) using each predictor Learn: Agents learns about how predictor has performed in past Rank: Agents assign scores and rank the predictors Use Best: Use ‘best performing predictor’ from predictors set
Model Implementation in Netlogo • Simulation model, coded in Netlogo • A modeling environment for agent-based systems • Many useful primitives that expedite the implementation • Extensive documentation and tutorials, model libraries • Updated versions are continuously released
Results (Impact of Tolerance, Interval on Wait) Fig: Impact of tolerance on mean wait time of trucks Increases fast at low I Fig: Impact of tolerance on max waiting time.
Fig: Mean wait time of trucks (I =15 minutes, L = 15 minutes) Mean Wait Time Fluctuates Around Tolerance Fig: Mean wait time of trucks (I =10 minutes, L = 10 minutes)
Significantly Better Than ‘Do Nothing’ • 43% and 63% lower mean wait time for I = 5 and 10 mins • 22% and 40% lower maximum wait time for I = 5 and 10 mins
Provides steady truck arrival, less queuing time at gate • Adopt higher ‘I’ for distributing peak hour demand • Good amount of emission (PM2.5, NOx, GHG) reduction • First study on gate congestion using real-time information • Examines how dispatchers can benefit from real-time information. • Offers many experiments for choosing suitable parameters Key Findings and Contributions
Journal Article II Inter-Block Yard Crane Scheduling at a Marine Container Terminal by Omor Sharif, Nathan Huynh, Mashrur Chowdhury, Jose Vidal Transportation Science and Technology, 1 (2), 109-130 (2012)
Efficiency of Container Yard Operations is Crucial Water/ Vessel Side Land/ Gate Side • Container yard is the interface of land and waterside operations • Containers are temporarily stored in Container Yard • A container yard is made up of several blocks of containers • Workload varies (1) among blocks (2) over operational hours
Yard Cranes Influence Truck and Ship Waiting Time • Yard Cranes are deployed for container handling • Rubber Tired Gantry Cranes are most popular Yard Crane • Cranes support the ship loading and unloading operations • Cranes support external truck operations
Objective, Assumptions, Constraints Given: A limited number of cranes and workload at blocks GOAL: Assign and relocate cranes among blocks to minimize the workload that remains unfinished at the end of a period • Total operational hours is divided in several planning periods • A workload forecast for blocks is known at start (time-units) • At most two cranes work at a block at the same time • At most one transfer per planning period • 10 – 15 minutes transfer time for each block traveled
Rules for Initial Assignment of Cranes to Blocks • High to low work volume • Sort blocks in decreasing order of initial work volume (IWb) • Assign NCbmax cranes to each block starting from topmost item • Crane at each block • If nc = nb, assign one crane per block • If nc < nb, sort blocks in decreasing IWb , assign cranes • If nc > nb, first assign one crane per block, then sort in decreasing IWb • Reduce transfers • Assign cranes to reduce number of future transfers • A four step approach • Based on pass/fail of a series of inequalites
Three Principal Parameters of Model • Extra capacity of a crane • E (c) = Tc × NCbinitial− IWb • Time Period X Initial Number of Cranes – Workload of block • Amount of help needed by a block • H (b) = IWb − Tc × NCbcurrent • Workload of block - Time Period X Current Number of Cranes • Transfer time matrix • TTcod • Different transfer time for longitudinal and lateral movement
Matching using Deferred Acceptance Algorithm • Assigning cranes are viewed as matching crane and blocks • DAA is a market matching model by Gale and Shapley • Numerous follow up studies in Economics, Computer science • Find a match between two set of agents • Each agent has a preference order over other set of agents • ‘One to one’ matching – e.g. Marriage Problem • ‘Many to one’ matching – e.g. College Admission
Algorithm to assign cranes to blocks 1. Each crane jsend match request to first block i from its preference list 2. Each block i receiving more than qirequests, ‘holds’ the most preferred qi cranes and rejects all others. n. Each crane j rejected at step n − 1 removes the block i rejecting the crane from its preference list. Then the rejected crane j makes a new match request to its next most preferred block i who hasn’t yet rejected it. Go to step n − 1. (n = 3, 4, 5, …)
Implementation Snapshot from Netlogo • Multi-agent simulation GUI Create cranes Initial assignment Create workload Setup block layout Inter-block transfer matrix Pre-analysis steps Find Matching Reassign/update results
Test Parameters Based on Real-World Problems • Moderate Workload: 60% of total crane capacity ± 40% of average workload • Heavy Workload: 90% of total crane capacity ± 20% of average workload • Above Capacity Workload: 110% of total crane capacity ± 40% of average workload
Model Effectively Reduces Unfinished WorkloadPercentage incomplete work volume: (Incomplete/Total*100%)Case I - Average number of cranes per block = 1.0
Majority of Cases are Optimal/Near-optimalPercentage incomplete work volume: Case II - Average number of cranes per block = 1.5
Key Findings and Contributions • In ‘medium’ condition all work can be finished • In ‘heavy’ condition the percentage incomplete is 1% or less • In ‘above capacity’ condition the percentage remaining is within 3% of the lower bound. • ‘Reduce Transfers’ initial assignment works best. • An agent-based approach for solving inter-block scheduling problem • Provide several preference functions that are effective in minimizing • Scalable and time efficient, a problem with 30 blocks can be solved in 3 seconds • Several minutes to solve using Mixed Integer Programs • Provides various strategies for initial assignment of cranes to blocks
Journal Article III Storage Space Allocation at Marine Container Terminals Using Ant-based Control by Omor Sharif and Nathan Huynh Expert Systems with Applications, 40 (6), 2323-2330 (2013)
Assign Newly Arriving Containers to Yard Blocks Yard Blocks Berths Gates Export containers Export containers Import containers Import containers Land Side Water Side Container Yard Container yard is divided up into yard blocks Each yard block has a fixed total capacity Store export containers brought in by trucks Store import containers unloaded from ships Allocate yard blocks to newly arriving containers
Two Competing Objectives of SSAP • Balance the workload of blocks– Proper distribution of arriving containers amongst blocks • Minimize container transportation cost – Minimize the distance traveled by ITs between berth and yard
Workload Balancing is Critical Because… Workload Imbalanceis the variability of number of containers among blocks at some time (we used standard deviation for this measure). Reduces relocation of yard cranes Reduces waiting time of vessels Reduces average container handling time Reduces congestion on road network Improves efficiency of related resources (quay cranes, yard cranes, storage space, ITs) – Zhang et al., 2003
We Utilize an Ant-Based Control Ants have a decision to make Situation several months later ABC Falls under ‘Ant colony optimizations & algorithms’ Inspired by collective intelligence of an ant colony Can solve complex routing problems in network For example, used for shortest path, load balancing We utilize pheromone laying behavior of ants
Highlights of Ant Based Control for SSAP Fig: Ant choses path according to probability A container terminal is a network of gates, blocks, berths Links are bi-directional container transportation routes Network also support a traffic of artificial ant agents Ants move just like inbound & outbound containers Ants lay pheromone as a function of distance & congestion Probabilities in pheromone table guide ants & containers
Shortest Path • Ant age Increases with traveled distance • Probability of selection decrease with ant age Workload Balancing • Ants are delayed at congested blocks • Delay is proportional to degree of congestion
Simulation The snapshot of GUI of our simulation
Parameter and Values Used in Model A demand of 2500 Containers
Performance Metric I - Transport Distance • Converge to shortest path in 500 time-units • Under no congestion converge to lower bound • When congestion occurs distance converge to 2% above lower bound
Performance Metric II - Workload Imbalance • Standard deviation gradually rises when no congestion • When congestion occurs standard deviation falls • Maintains a distribution to accommodate both objectives
Key Findings and Contributions The approach is effective in balancing workload in blocks Reduces transport distances during ship loading/unloading Distributed allocation to individual containers Real-time solution requiring no advanced container arrival information, more suitable for real-world truck arrival Adaptive, scalable. Synchronous instead of traditional hierarchical approach
What is Multi-agent Systems and Agent-Based Modeling? A class of computational modeling For simulating the actions and interactions of autonomous, intelligent agents To assess the agents’ effects on the system as a whole. ABMs are individual-based models Most agent-based models are often composed of: agents with simple or complex goals distributed decision-making heuristics; learning rules or adaptive processes; an interaction system; and a non-agent environment