Download

1 / 27
320 likes | 654 Vues
INERTIZATION SYSTEM OF STEEL CASTING WITH PHOENICS. IX International PHOENICS Users Conference Moscow, 26 th September 2002. AUTHORS. Chemtech - A Siemens Company, Rio de Janeiro / RJ – Brazil Flávio Martins de Queiroz Guimarães Bruno de Almeida Barbabela Luiz Eduardo Ganem Rubião

E N D
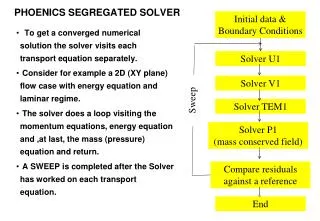
INERTIZATION SYSTEM OF STEEL CASTING WITH PHOENICS IX International PHOENICS Users Conference Moscow, 26th September 2002
AUTHORS Chemtech - A Siemens Company, Rio de Janeiro / RJ – Brazil Flávio Martins de Queiroz Guimarães Bruno de Almeida Barbabela Luiz Eduardo Ganem Rubião CST - Companhia Siderúrgica de Tubarão, Serra / ES – Brazil Henrique S. Furtado Sergio Lopes Mattedi
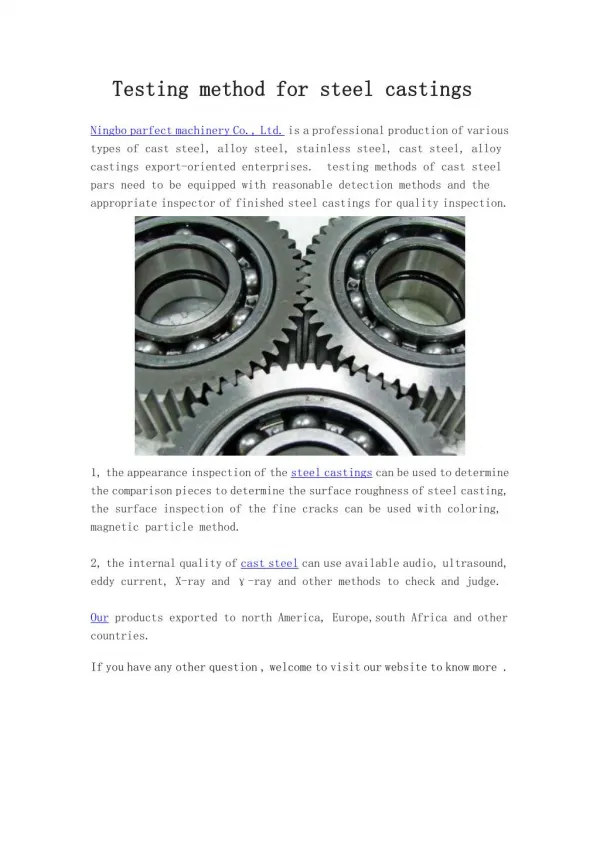
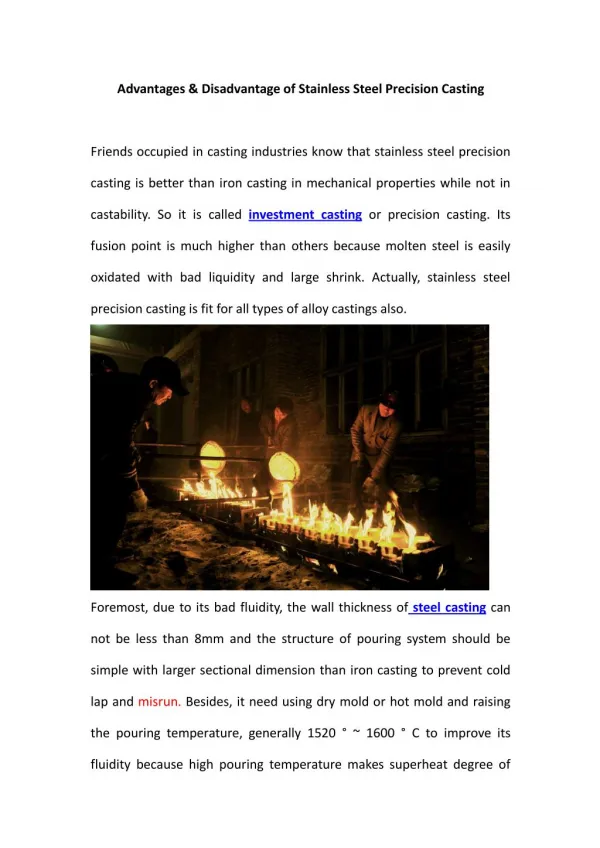
INTRODUCTION – THE PROBLEM • Oxidation of the steel surface during casting producing metallic oxides • Obstruction of all discharge pipes • Addition of impurities and reduces process yield Aluminum Oxide Crystals Longitudinal Section
ARGON IN OXYGEN OUT INTRODUCTION – THE SOLUTION • Introduction of inert gases in the casting system to expel the existing atmosphere • This process usually makes use of noble gases as argon, which is very expensive to purchase • Simulations have been executed to predict the optimal argon inflow, time of inertization and process yield with minimum operational costs of impurities and reduces process yield
TUNDISH INTRODUCTION – THE SYSTEM
Frontal View BAFFLES Upper View THE TUNDISH – GEOMETRY STRUCTURE OUTLETS & INLETS (IN BLUE)
GENERAL SETTINGS • All simulations were run on PHOENICS v3.4. • The follow configurations were setting: • Total Geometry: 9494 mm x 1543 mm x 1790 mm • Grid: 270 000 volume elements (cartesian grid) • PARSOL: active • Energy Equation: active • Turbulence Model: k- Chen-Kim model (KECHEN) • Transient Solution: active • Total Number of Outlets: 3 (three) outlets • Total Number of Injectors: 3 (three) to 8 (eight) injectors • Argon Inlet Rate: 250 to 380 Nm3/h • Property models computed by INFORM.
PROPERTIES SETTINGS – SPECIFIC HEAT • The following formulae for the pure components were used: • Based on the above pure component specific heats, a formula for the mixture specific heat was developed. It was considered in this formulation that the mixture is ideal and that the air has a constant composition (21% O2).
PROPERTIES SETTINGS – DENSITY • The following formula describe the evaluation of the mixture density. It was considered in this formulation that the mixture is ideal and binary (argon and air only).
PROPERTIES SETTINGS – VISCOSITY • The following formula describe the evaluation of the mixture viscosity. It was considered in this formulation that the viscosity is independent of the mixture composition. The temperature was computed, despite of the great difference of temperature among the air inside the tundish and argon inlet by nozzles.
PROPERTIES SETTINGS – DIFFUSIVITY • The following formula describe the evaluation of the mixture diffusivity. It was considered in this formulation that the mixture is ideal and binary (argon and air only).
OUTLETS OUTLETS OUTLETS 1 2 3 4 5 ARGON NOZZLES BAFFLES FIELD TEST VALIDATION • 5 (five) sample points have been measured to analyze the dynamic behavior of the process
FIELD TEST VALIDATION – TURBULENCE • Although both models fitted well this data, the k- Chen-Kim • (KECHEN) was chosen because the simulations results have • shown that it had a little better mean correlation value and • first step result fitted closer to the experimental curve.
Time = 1 minute Time = 2 minutes Time = 3 minutes OXYGEN CONCENTRATION
Time = 4 minutes Time = 5 minutes OXYGEN CONCENTRATION
FINAL CASE • Several simulations have been performed • The injections were relocated in order to avoid stagnation zones • The following figures show the results for the final optimum injection pattern, as currently implemented for daily operation (maximum residual oxygen concentration after 5 minutes of 2.08 %v/v):
FINAL CASE – OXYGEN PROFILE OXYGEN CONCENTRATION AFTER 5 MINUTES
FINAL CASE – OXYGEN ISOPLETH OXYGEN CONCENTRATION AFTER 5 MINUTES
CONCLUSION The results showed: • Excellent quantitative agreement with field data and good qualitative behavior • How CFD simulations are becoming even more a very important tool for equipment optimization in the process industries
FINAL THANK YOU & QUESTIONS